India's Middle Class, 2014–2026: Five Pillars, Three Tensions
How has the Indian middle class fared between 2014 and 2026? This essay reads the public data across five pillars: income and consumption, household debt, investing behaviour (long-term and speculative), the labour market, and emigration. The picture is plural. Extreme-poverty headcount fell from 16.2 percent (2011–12) to 2.3 percent (2022–23) on the World Bank's measure. The net household financial savings rate hit a five-decade low at 5.1 percent of GDP in FY23. Ninety-one percent of individual futures-and-options traders lost money in FY25. The following sections assemble the evidence pillar by pillar and identify three tensions any honest reading has to carry.
Pritosh Kumar · UW–Parkside SCMPublished: May 2026Data current through Mar 2025 (most series), FY25 (SEBI, AMFI), Sep 2025 (RBI FSR)
2.3%
Extreme-poverty headcount, 2022–23, down from 16.2 percent in 2011–12
World Bank, May 2025 (MMRP basis)
5.1%
Net household financial savings as share of GDP in FY23 — the lowest in roughly five decades
RBI Annual Report 2024–25
91%
Share of individual futures-and-options traders who lost money in FY25
SEBI study, July 2025
5.42 cr
Unique mutual-fund investors at end-March 2025, up from 2.2 crore in March 2020
SEBI Annual Report 2024–25
Who is the middle class?
Five archetypes inside one label
Five distinct lived experiences sit inside the term "middle class" as 2026 begins. Each is described by a different slice of the public data; none is the average Indian; the same household can include several of them simultaneously. The five together set up the pillars and the tensions that follow.
The trader
Under 30, B30 city, declared income under five lakh
One of the 96 lakh individuals who traded equity futures and options in FY25. Forty-three percent are under thirty. Seventy-two percent live in cities outside the top thirty — what the markets call "B30." Seventy-five percent declared annual income below ₹5 lakh. They lost an average of ₹1.1 lakh in FY25, and three out of four of those who lost money kept trading the next quarter.
The mutual-fund investor
From a Tier-3 city, started a SIP three years ago
One of the 5.42 crore unique mutual-fund investors at end-March 2025, up from 2.2 crore in March 2020. The deepest growth came from Tier-3 cities (3.26 crore investors, up from 2.65 crore the year before). Average monthly Systematic Investment Plan (SIP) inflow grew from ₹7,259 crore in FY20 to ₹13,052 crore in FY25. Individuals hold 58 percent of the industry's assets and 97 percent of the folios.
The borrower
Carrying ₹4.8 lakh in debt, with a gold loan added last year
Average debt per individual borrower rose from ₹3.9 lakh (March 2023) to ₹4.8 lakh (March 2025) — up 23 percent in two years. Non-housing retail loans — personal, credit card, gold, two-wheeler — are now 55 percent of all household borrowings. Gold loans alone grew at triple-digit rates through 2025. The household debt stock looks moderate (41 percent of GDP, low for an emerging market), but the flow is racing ahead of household income.
The worker
Still in agriculture, even after a decade of "Make in India"
Forty-six percent of India's workforce was in agriculture in 2023–24, up from 42.5 percent in 2018–19. Manufacturing has stayed flat at 11.4 percent for the entire decade. The official unemployment rate is 3.2 percent — but Azim Premji University's reanalysis puts unemployment among graduates under 25 at 42 percent. The structural transformation everyone expected, from farms to factories, did not happen at the speed expected.
The emigrant
Heading to Toronto or London on a student visa, not Dubai on an ECR clearance
About 18.5 million Indians live abroad as first-generation migrants (UN-DESA, 2024). Cumulative formal renunciations of Indian citizenship totalled 1.71 million across 2014–2024. The composition shifted up the skill ladder: emigration clearances for Gulf-bound unskilled workers collapsed from 805,000 in 2014 to 361,000 in 2017 (Jan–Nov), while Indian student and skilled-work visas to Canada, the United Kingdom, the United States, and Australia rose sharply over the same window.
A single household can include a trader, an SIP investor, a borrower, a worker, and a relative who has emigrated. Aggregated statistics flatten this texture; the five pillars below are an attempt to keep it visible.
Pillar 1 · Income & Consumption
Sharp poverty decline, with an in-kind transfer behind it
By the World Bank's revised estimates, extreme poverty in India fell from 16.2 percent in 2011–12 to 2.3 percent in 2022–23. The Lower-Middle-Income-Country poverty line ($4.20 a day in 2021 PPP terms) shows a fall from 57.7 percent to 23.9 percent over the same window.
This comparison crosses an important methodology break. The 2011–12 round of MoSPI's Household Consumer Expenditure Survey (HCES) used the Uniform / Mixed Reference Period (URP / MRP) recall convention; the 2022–23 round used the Modified Mixed Reference Period (MMRP) more uniformly, and changed the item list and household-survey design. The World Bank explicitly recalculates 2011–12 on MMRP for comparability — but the comparability is reconstructed, not direct. Independent reconstructions by Drèze and Somanchi, Subramanian, and others give consistent directional findings while flagging the comparability concerns.
A material driver of the consumption-poverty fall is often missing from this conversation: the Pradhan Mantri Garib Kalyan Anna Yojana (PMGKAY), the free-foodgrain programme that reached roughly 80 crore (800 million) beneficiaries through 2020–2024 and was extended for five years from January 2024. HCES 2022–23 imputes the in-kind value of foodgrain transfers into household consumption; without that imputation, the headline poverty fall would be smaller. Independent estimates (IMF working papers; Bhalla et al. on pandemic poverty) attribute a meaningful share of the post-2020 poverty reduction to the PMGKAY consumption floor. Any honest reading of the 2.3 percent extreme-poverty number must carry the in-kind-transfer dependence.
The two-round HCES sequence (2022–23 to 2023–24) shows nominal monthly per-capita consumption growing at-or-above CPI inflation: rural Monthly Per Capita Consumption Expenditure (MPCE) rose 9.2 percent year-on-year, urban 8.3 percent. NABARD's Rural Financial Inclusion Survey records rural household income growing 57.6 percent in nominal terms (about 24 percent real after inflation) between 2016–17 and 2021–22.
The post-2020 picture has one more contested element. Pew Research, in March 2021, recorded the COVID shock: 32 million Indians dropped out of the middle class and 75 million fell into poverty in 2020. Pew has not published an India follow-up. Whether the middle class came back is a question Pew has not answered, and which the closest available substitute — the PRICE ICE 360 survey, with the most-cited ₹5–30 lakh middle-class income band — cannot be replicated for this page (the data requires direct PRICE access).
The aggregate-up consumption story has a counter-narrative on the income side. The World Inequality Lab (Bharti, Chancel, Piketty and Somanchi, 2024 working paper) reports the top 1 percent's income share at 22.6 percent and wealth share at 40.1 percent — described in the paper as "the highest historical levels". These figures face high-profile pushback from Arvind Panagariya, Surjit Bhalla, and others on the tax-extrapolation methodology used to build top-end income shares from limited income-tax microdata. Both perspectives belong on the table; the polarisation framing reads as honest only with the methodological debate explicit.
What this page does not claim: a clean count of how many Indians were in the ₹5–30 lakh middle class in 2014 vs 2026. The PRICE ICE 360 survey is the only source that measures that band directly across waves; it requires institutional data access we do not have. The WB consumption boundary and the Pew $10/day income boundary use different units and different thresholds; the gap between WB's "above-LMIC" share (76.1 percent in 2022–23) and Pew's "middle-income" share (about 4.8 percent post-pandemic 2020) is roughly sixteen-fold and almost entirely a definition artefact.
Pillar 2 · Household Debt
Lower total, different composition
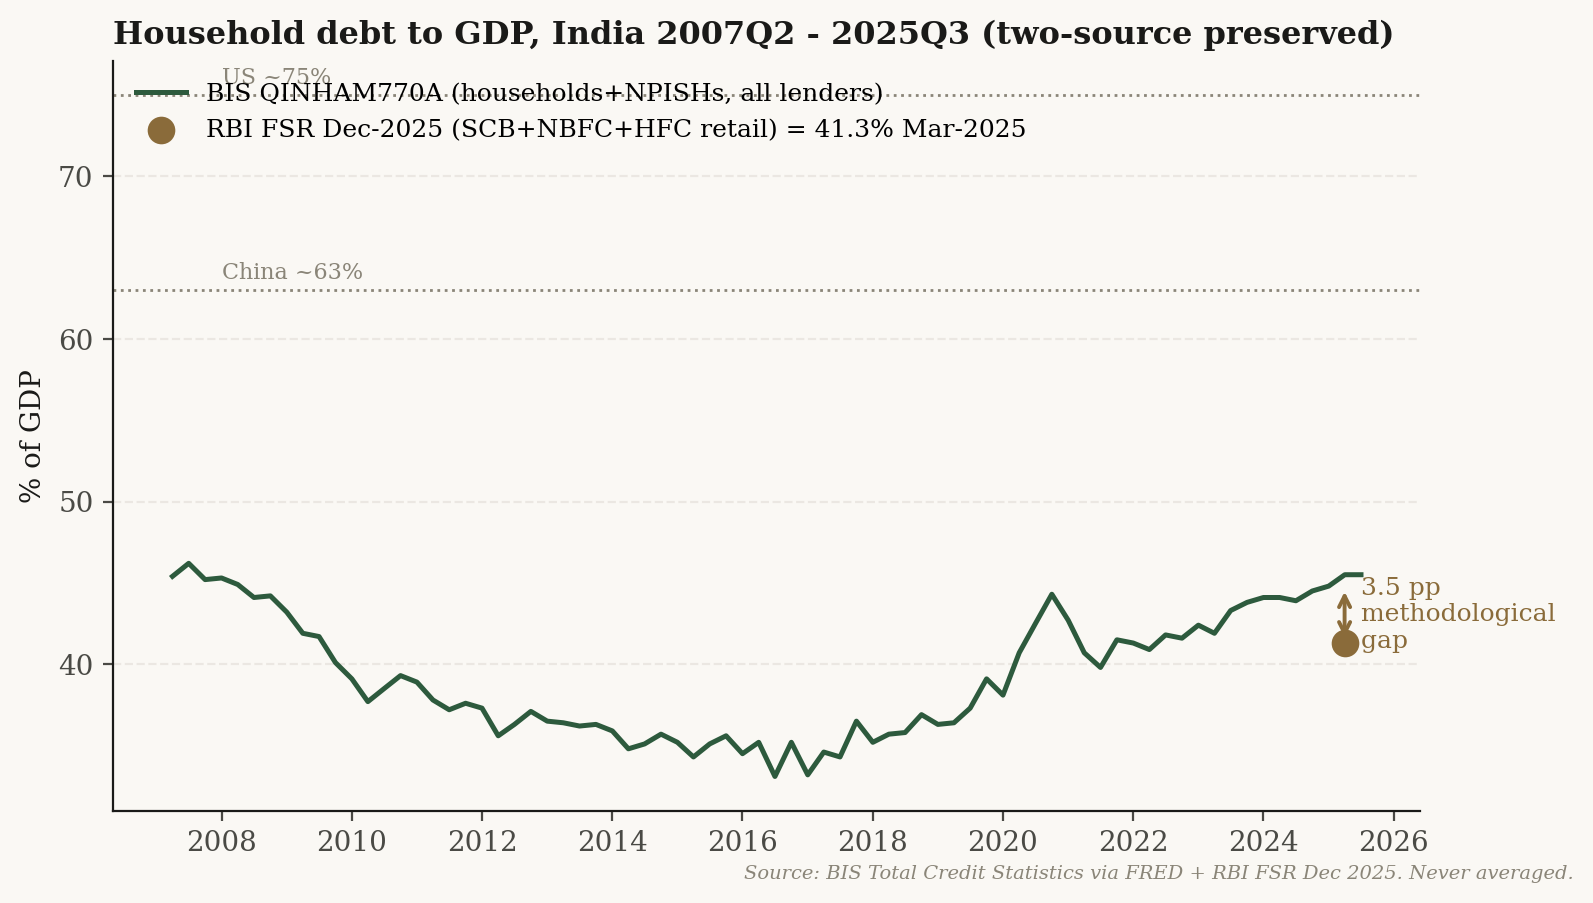
The headline "India's household debt is low by emerging-market standards" is technically true and substantively misleading. The total debt-to-GDP ratio — 41.3 percent at end-March 2025 (RBI Financial Stability Report December 2025) — sits below Thailand's 88 percent, Malaysia's 70 percent, and China's 60 percent. But what counts as "household debt" in those countries is overwhelmingly housing-secured: mortgages account for 50 to 75 percent of household borrowings in most of the comparison set. In India, mortgages are only 28.6 percent. Consumption-purpose loans — personal loans, credit cards, gold loans, durable-goods loans — are 46 percent of household borrowings (RBI FSR Sept 2025), the largest single bucket. India is the rare emerging market where the household-debt ratio is moderate and the composition is consumption-heavy rather than asset-secured. The two facts have to be read together.
India's household debt as a share of GDP: BIS quarterly series (which includes households and non-profits, and credit from all lenders) versus the RBI Financial Stability Report point estimate (which counts retail credit from scheduled commercial banks, NBFCs, and housing-finance companies only). The 3.5 percentage point gap is methodological — the two are reported side by side, never averaged. Source: BIS Total Credit Statistics via FRED; RBI FSR Dec 2025.
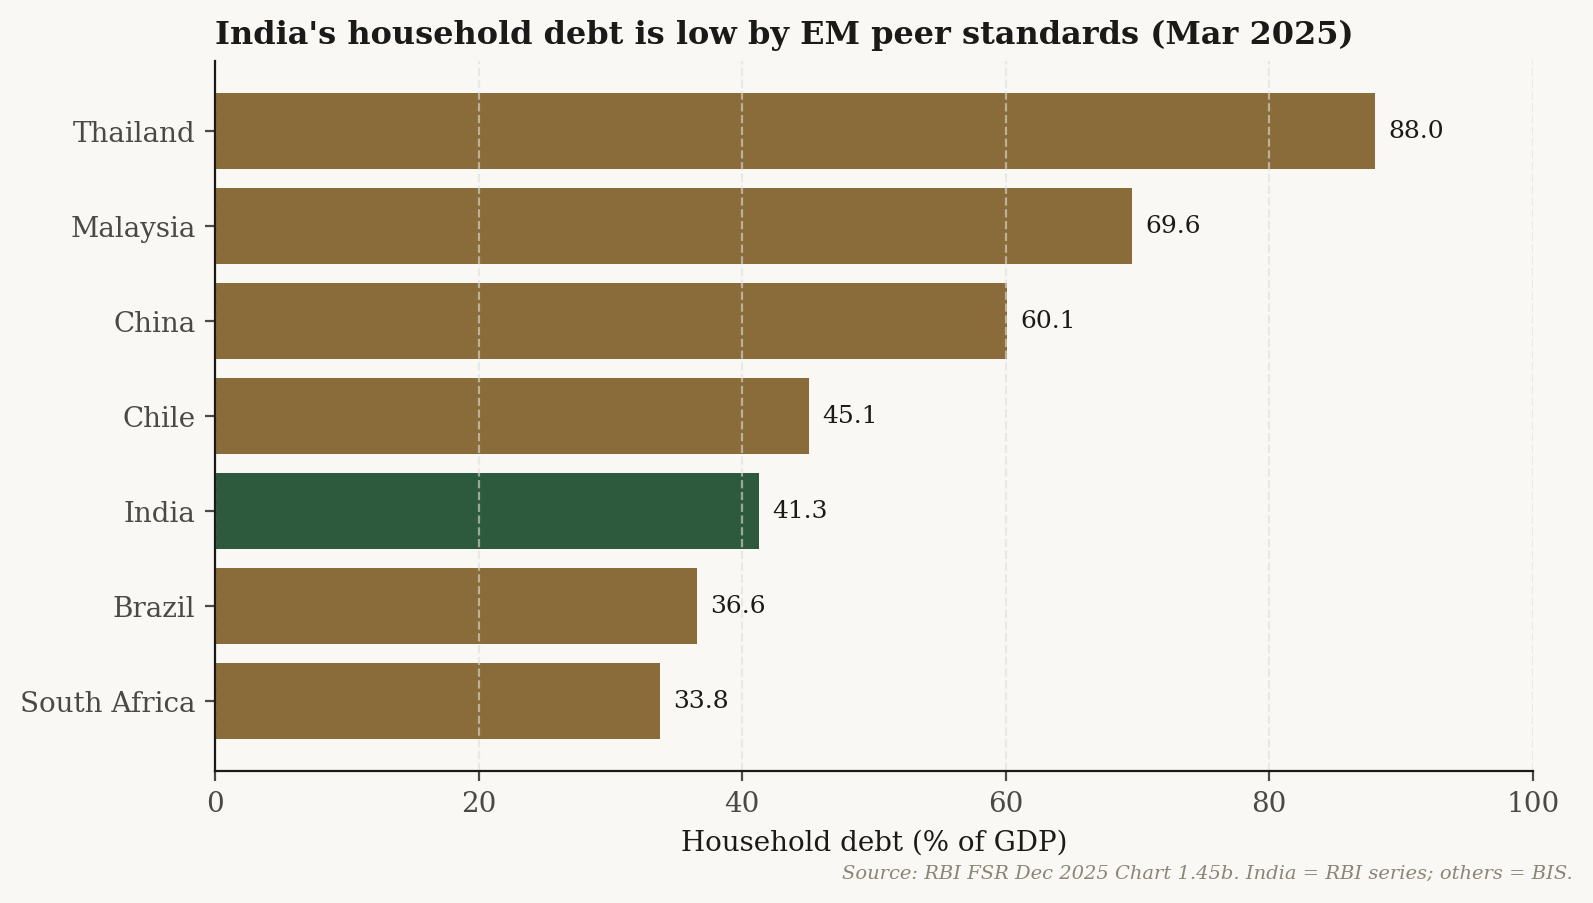
Where India sits among emerging-market peers
Household debt as share of GDP, March 2025. India sits at 41.3 percent — below Thailand, Malaysia, China, and Chile, but above Brazil and South Africa. Source: RBI FSR Dec 2025 Chart 1.45b. India series is RBI; peer countries from the BIS database.
The composition tells a different story
RBI's December 2025 Financial Stability Report breaks household borrowings into three buckets at end-September 2025 (Chart 1.48a):
Consumption-purpose borrowing is now the largest single bucket at 46 percent of household debt, and it grew 19 percent year-on-year through September 2025. Indexed to March 2019 = 100, non-housing retail loans stood at 323 by September 2025 — a 223 percent rise in six and a half years — against housing loans at 225 (+125 percent) and agri/business at 279 (+179 percent). Average debt per individual borrower rose 23 percent over two years, from ₹3.9 lakh (March 2023) to ₹4.8 lakh (March 2025).
The fastest-growing slice is gold loans. The RBI's sectoral deployment of bank credit reports gold-loan stock growing at triple-digit annual rates through 2025 (+118 percent year-on-year in August, +128.5 percent in October, +125 percent in November). TransUnion CIBIL records the gold-loan share of retail credit nearly doubling, from 5.9 percent in March 2022 to 11.1 percent in December 2025. Net household financial savings fell to 5.1 percent of GDP in FY23, a level not seen in roughly five decades.
Counter-narratives that belong in the conversation. When the 5.1 percent figure broke in September 2023, the Ministry of Finance issued a substantive rebuttal arguing that the drop reflects a shift toward physical assets (real estate, housing) rather than a fall in total household saving. This is consistent with the 125 percent rise in housing-loan stock since March 2019. The MoF position is contested — it requires assuming the housing-stock data captures the full shift — but it deserves to be in the conversation. Two things are not contested: net financial savings did fall sharply, and household credit growth has outpaced household income growth. Separately, the rise in non-housing retail and gold loans is widely framed as "distress liquidity," but at least part of it is formalisation: borrowers migrating from informal moneylenders to formal NBFCs and fintech lenders, captured by CIBIL New-to-Credit data and the RBI Financial Inclusion Index. Distress and formalisation can both be true; the data does not yet allow a clean decomposition.
One pressure point worth flagging is the fintech-NBFC layer specifically. By September 2025, fintech firms held 8.9 percent of total NBFC consumer-segment lending (up from 7.3 percent in September 2023). Their loan books grew 36.1 percent year-on-year. Over 70 percent of fintech NBFC books are unsecured, and over 50 percent of those unsecured loans are extended to borrowers under 35. Small-ticket personal-loan impairment (loans up to ₹50,000) ran at 3.3 percent at the fintech firms versus 1.7 percent at other NBFCs, and impairment rises sharply for borrowers with five or more unsecured-loan lenders. If the "low stock, fast flow" concern materialises into a stress event, the proximate trigger is most likely this layer rather than the bank book.
Two-source rule note: India's household-debt-to-GDP figure is preserved at two values, never averaged. RBI Financial Stability Report Dec 2025 = 41.3 percent (counts retail credit from scheduled commercial banks, NBFCs, and housing-finance companies). BIS QINHAM770A = 44.8 percent at end-March 2025 (counts a wider lender set including small-finance banks, cooperatives, and non-profit institutions serving households). The 3.5 percentage point gap is documented in the project's comparability-breaks register.
Pillar 3 · Investing
Long-term saving and speculative trading, in parallel
Household participation in Indian capital markets expanded substantially after 2020. Two parallel patterns sit inside that expansion: a long-term mutual-fund and SIP build-up that is broad-based and durable, and a speculative futures-and-options segment in which individual traders have lost roughly a lakh crore (one trillion rupees) per year.
Long-term: mutual funds, SIPs, and demat accounts
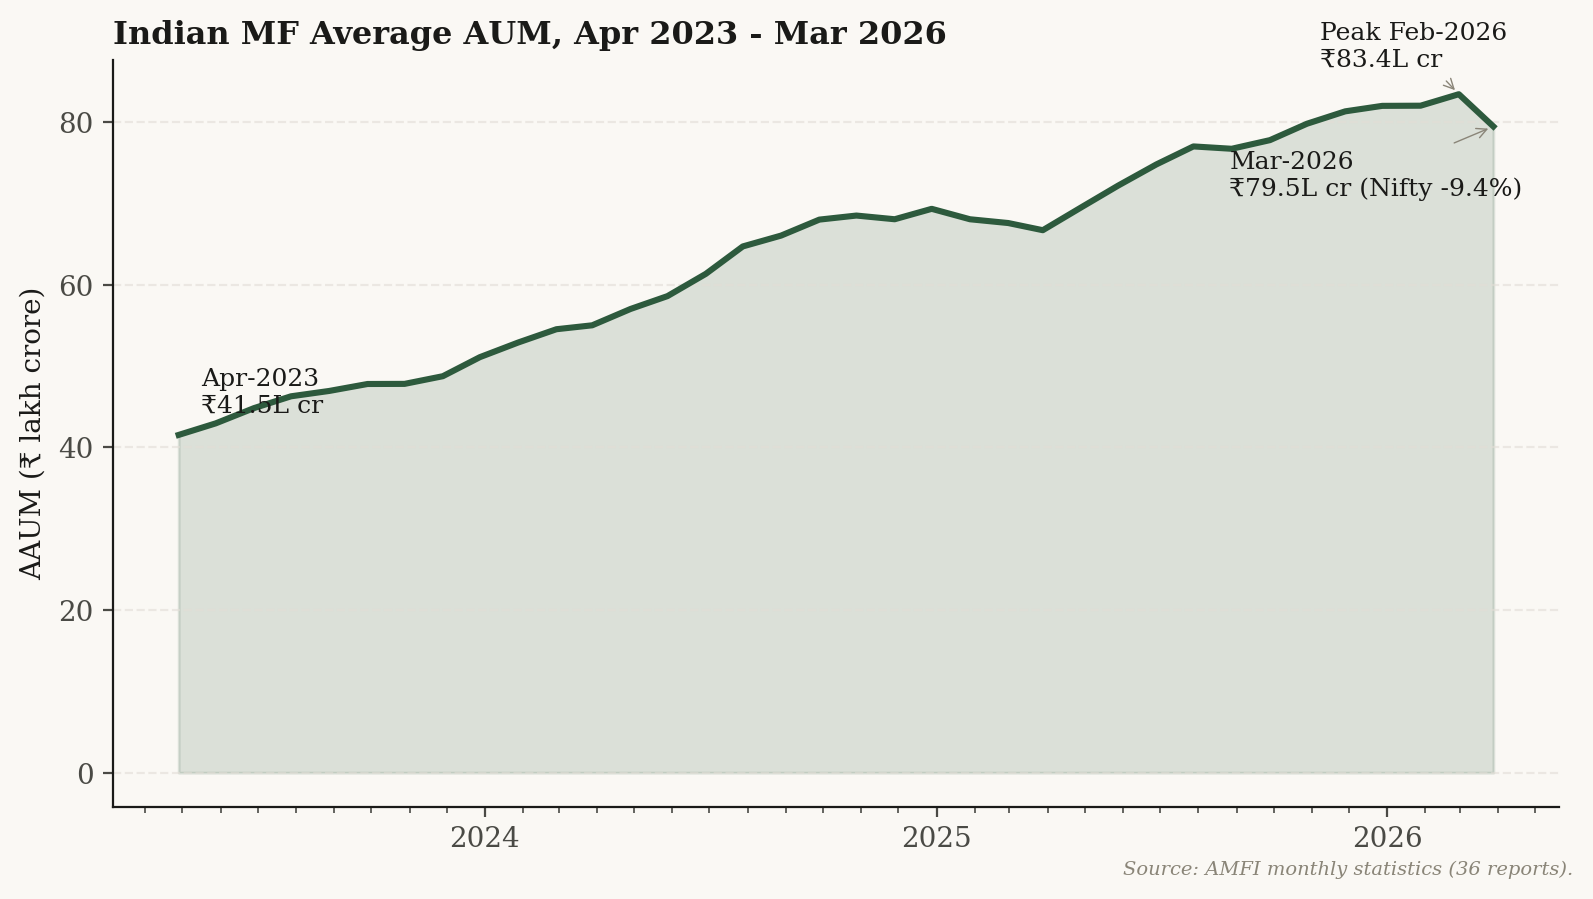
The Indian mutual-fund industry's assets under management tripled from ₹22.3 lakh crore in March 2020 to ₹65.7 lakh crore in March 2025 (SEBI Annual Report 2024–25). Unique investors rose from 2.2 crore to 5.42 crore over the same period. The deepest growth came from Tier-3 cities (3.26 crore investors at March 2025, up from 2.65 crore in March 2024); Tier-2 cities added another 1.03 crore; Tier-1 cities 1.13 crore. Average monthly SIP inflow nearly doubled, from ₹7,259 crore in FY20 to ₹13,052 crore in FY25.
Indian mutual-fund Average Assets Under Management, monthly Apr 2023 to Mar 2026. From ₹41.5 lakh crore at the start of the window to a peak of ₹83.4 lakh crore in February 2026; the March 2026 reading dipped to ₹79.5 lakh crore alongside a 9.4 percent monthly fall in the Nifty 50. Source: AMFI monthly statistics.
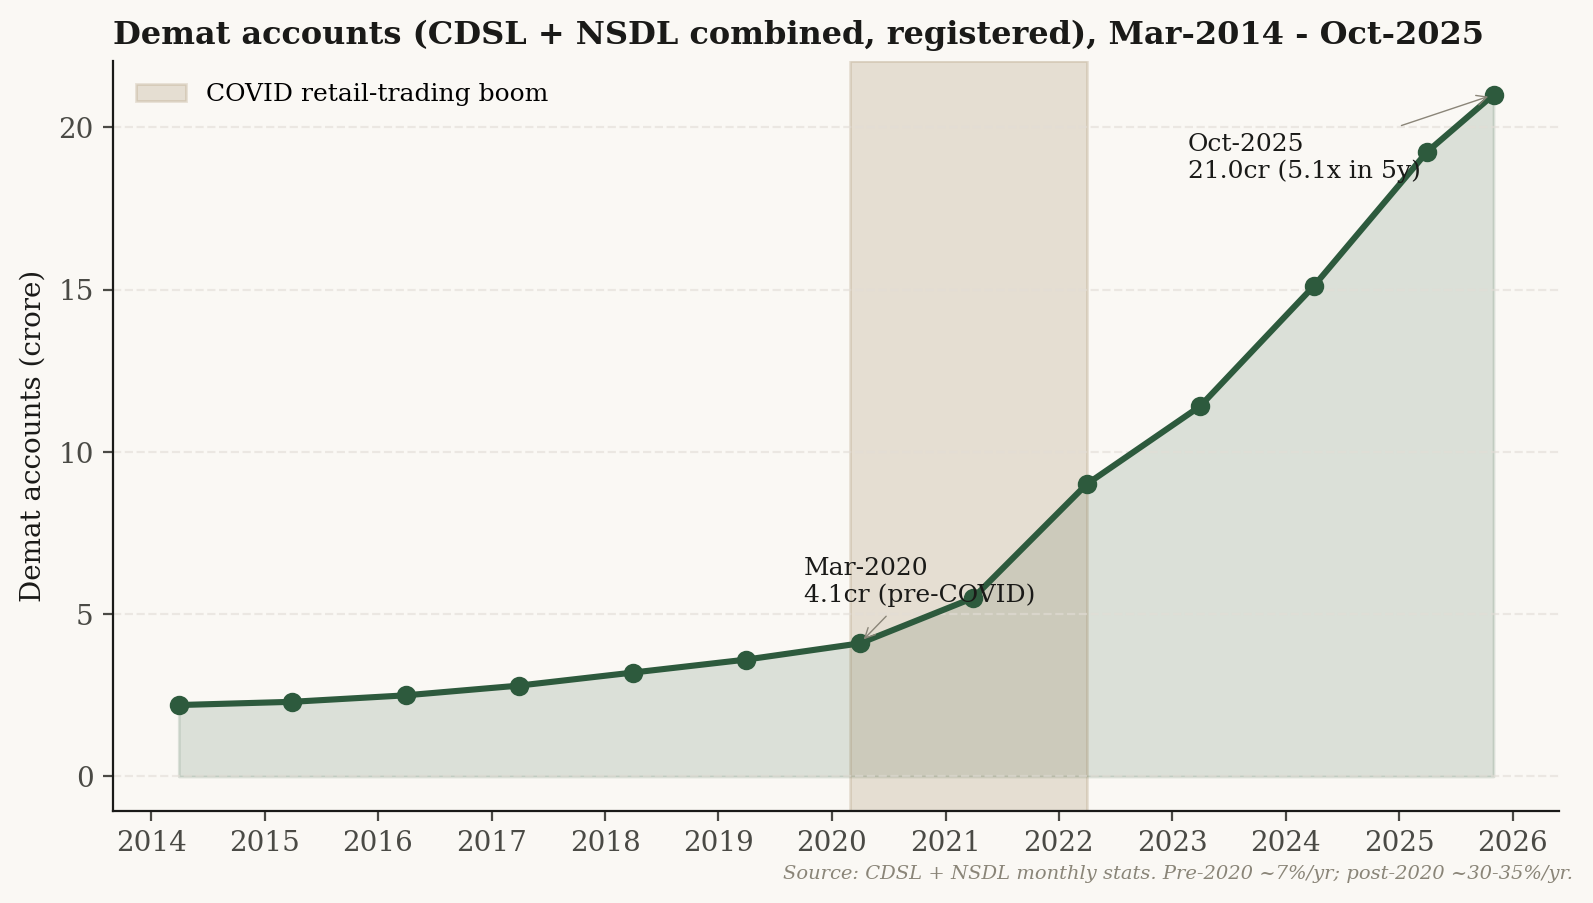
Demat accounts (the digital security-holding accounts required to trade equities) tell the same story at the household level. Combined CDSL and NSDL registered demat accounts went from 4.1 crore in March 2020 to 21 crore by October 2025 — a fivefold increase in five and a half years.
Combined CDSL + NSDL demat accounts (registered), 2014–2025. The pre-2020 slope was about 7 percent per year; post-2020 it ran at 30–35 percent per year. Source: NSDL and CDSL monthly statistics.
The class story under the boom
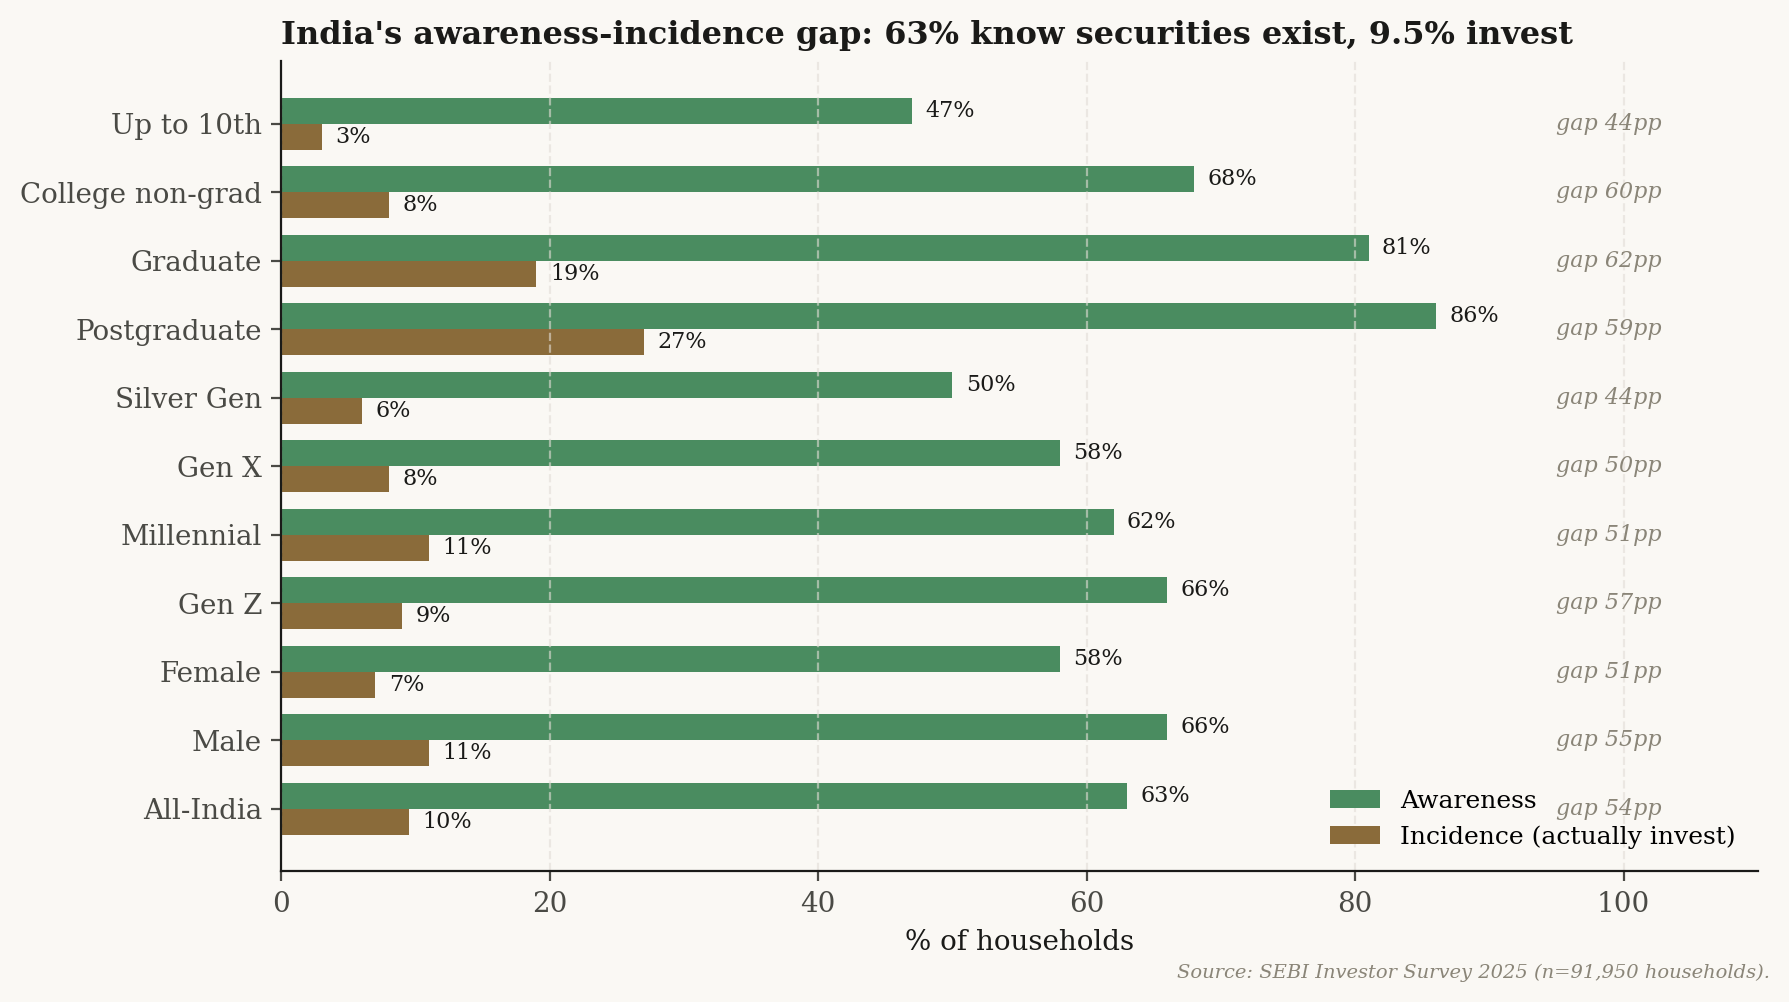
The SEBI Investor Survey 2025 (released January 2026, based on 91,950 households) puts the headline India-wide securities-market participation rate at 9.5 percent of households. Awareness, however, runs much higher: 63 percent of households know at least one securities-market product exists. The gap — people who know about markets but do not invest in them — is more than fifty percentage points wide and is the population SEBI's investor-education programmes target.
India's awareness-incidence gap, by cohort. Even among postgraduates — the cohort with the highest awareness at 86 percent — only 27 percent actually invest. Source: SEBI Investor Survey 2025, n = 91,950 households.
The gradient by socio-economic class (SEBI uses the marketing-research NCCS classification, where A is the highest) is steeper than the gradient by city-size or by education:
Cohort
% of HHs investing
NCCS A (highest socio-economic class)
24%
NCCS B
5%
NCCS C / D / E (lower three classes)
2%
Postgraduate
27%
Up to 10th standard
3%
Top 9 metros
23%
Rural villages, population < 2,500
5%
The class gap (NCCS A 24 percent vs NCCS C/D/E 2 percent = 12×) is sharper than the urban-rural gap (15 percent vs 6 percent = 2.5×) and sharper than the education gap (postgraduate 27 percent vs up-to-10th 3 percent = 9×). This is, in part, baseline economic reality — discretionary financial investment in any developing economy concentrates in the upper-middle class — but the magnitude is worth naming. India's market boom has reached the middle of the country geographically (60 percent of mutual-fund investors are now in Tier-3 cities) while remaining narrow socio-economically.
Speculative: the F&O disaster
Futures and options (F&O) are derivative contracts whose value depends on an underlying index or stock; they offer leveraged exposure to market movements and are concentrated on the National Stock Exchange's index-options segment. SEBI's July 2025 study and its September 2024 predecessor follow individual F&O traders across FY22 to FY25.
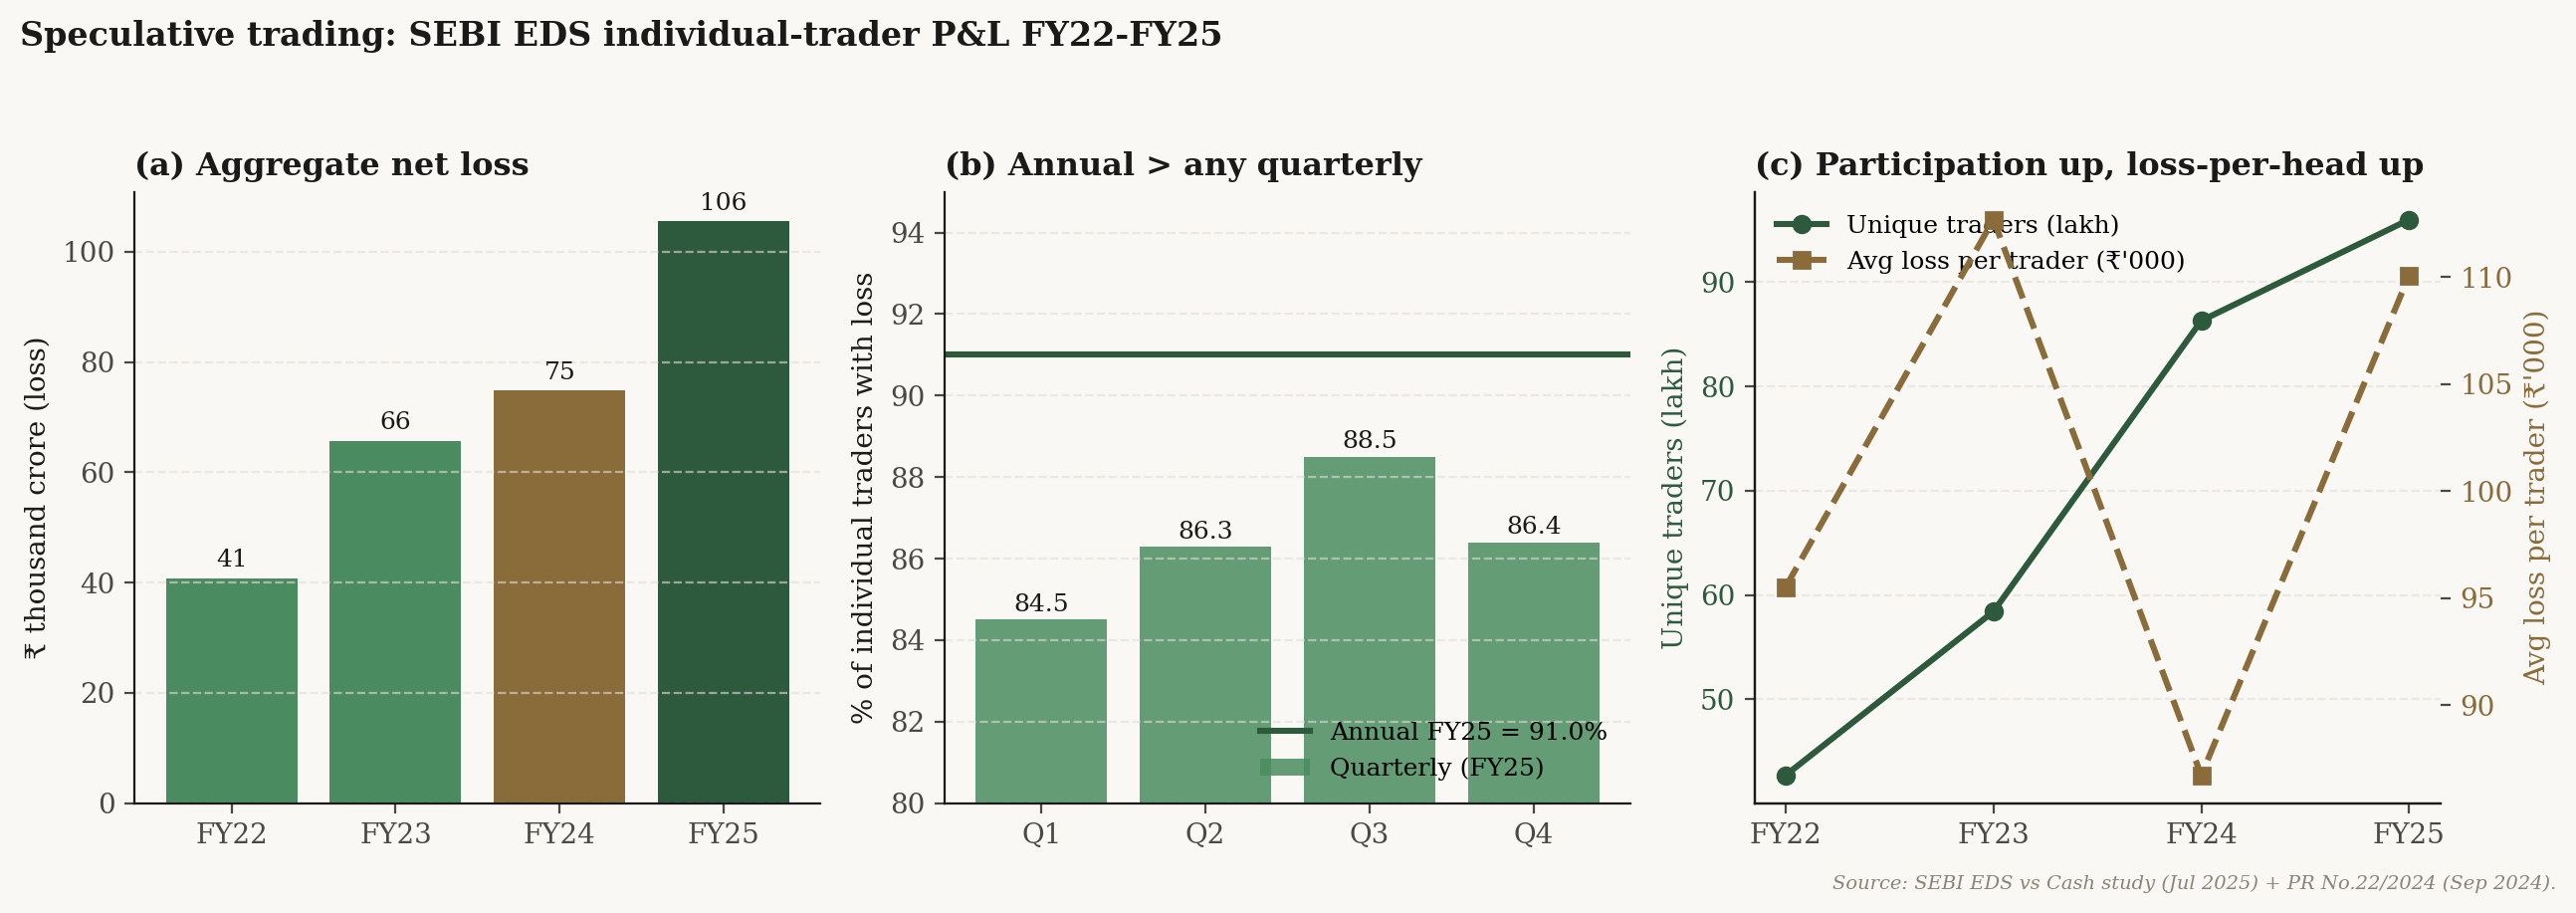
Speculative trading: SEBI's individual-trader profit-and-loss panel, FY22–FY25. Aggregate net loss rose from ₹40,824 crore in FY22 to ₹1,05,603 crore in FY25 — a 41 percent jump in the most recent year alone. The annual share of traders making a net loss (red horizontal line at 91 percent) sits above any single quarter's loss share within FY25 (the bars), because many traders profit in some quarters but lose across the full year. Source: SEBI EDS vs Cash market study, July 2025; SEBI PR No.22/2024.
In FY25, 96 lakh individual F&O traders lost an aggregate ₹1.06 lakh crore — a 41 percent jump on FY24's ₹74,812 crore. 91 percent of individual traders made a net loss, broadly stable across FY22–FY25 at 90.2 / 91.7 / 91.1 / 91.0 percent. The demographics from the September 2024 SEBI study are stark:
Under 30 years old (FY24)
43%
Up sharply from 31 percent in FY23. The youngest cohort took the largest single-year jump in F&O participation.
From B30 cities
72%
"B30" means cities outside the top 30. Mutual-fund investors are 62 percent B30 by comparison — F&O is geographically more dispersed than long-term investing.
Declared annual income < ₹5 lakh
75%
Three out of four FY24 individual traders. Tax-bracket management or student status may explain part of this; the headline is striking either way.
The institutional counter-party to the individual-trader loss is well-documented. Foreign portfolio investors and proprietary trading firms together booked roughly ₹61,000 crore in gross trading profits in FY24 (FPIs ₹28,000 crore, proprietary ₹33,000 crore), and SEBI reports that 96–97 percent of those profits came from algorithmic trading. The transfer is structural: leveraged retail flows into a market dominated by algorithmic counter-parties.
A SEBI tightening package in November 2024 (rationalised weekly products, intraday position-limit monitoring, contract-size increases) reduced quarterly trader counts from 61.4 lakh in Q1 FY25 to 42.7 lakh in Q4 FY25 — a 30 percent drop, concentrated at the smallest-trader end (the bucket with under ₹10,000 in turnover fell 30 percent year-on-year, while the bucket above ₹10 crore in turnover fell only 11 percent). Despite consecutive years of loss, three out of four loss-making individual traders continued trading the next quarter.
An apparent inconsistency, addressed. The F&O traders are 75 percent low-income (declared income under ₹5 lakh), while the SEBI Investor Survey 2025 says broad securities-market participation is overwhelmingly NCCS A (24 percent of A households participate vs 2 percent of C/D/E). The reconciliation is partly tax-bracket management (declared income is not the same as actual income), partly student status (especially in the under-30 cohort), and partly that F&O participation is a within-household question that the household-level SEBI survey may not fully capture. The two pieces of evidence are not contradictory; they describe different units of observation.
The retailisation of long-term saving is largely real, but it has a price-effect component worth naming. RBI's December 2025 FSR (Chart 1.51b) decomposes the household financial-wealth gain since the start of FY20 into its sources: 69.5 percent is gross financial saving flow (real new money entering financial assets — bank deposits, insurance, provident-fund, mutual funds, equity) and 30.5 percent is asset-price appreciation on the existing stock. The "Indians abandoning deposits for equity" narrative is roughly two-thirds genuine new flow and one-third mark-to-market. Within the new flow itself, mutual funds alone accounted for only about 6 percent of FY23 household-savings flow (RBI Bulletin July 2024) — bank deposits, insurance, and pension still dominate the composition of new saving.
Two-source rule note: Mutual-fund AUM at March 2025 = ₹65.7 lakh crore. AMFI's monthly aggregate (end-March 2025) and SEBI's Annual Report 2024–25 both report this figure exactly. SIP avg monthly FY25 = ₹13,052 crore, identical in both. The earlier comparison cell that "agreed within rounding" was an Average AUM (a 12-month period average) versus an end-of-period AUM — corrected to compare like with like.
Pillar 4 · Labour Market
Agriculture share rising, manufacturing flat
India's headline unemployment rate, at 3.2 percent in 2023–24 (PLFS, age 15+, principal + subsidiary status), reads as benign on its own. The sectoral composition of employment tells a different story.
Agriculture's share of the workforce rose from 42.5 percent in 2018–19 to 46.1 percent in 2023–24. Manufacturing has been flat at 11–12 percent of the workforce for the entire decade. The agricultural rise is partly the COVID reverse-migration spike (the share peaked at 46.5 percent in 2020–21 and has settled around 46 percent rather than reverting to the pre-COVID 42 percent floor). Calling this a "stall" rather than a "reversal" is the correct framing — but the structural transformation everyone expected, from farm to factory to formal services, is not in the data.
Sector share of workforce (PS+SS, 15+)
2018–19
2023–24
Agriculture & allied
42.5%
46.1%
Manufacturing
12.1%
11.4%
Services (residual)
~45%
~43%
The Annual Survey of Industries 2022–23 — which covers organised manufacturing only, not the much larger unorganised manufacturing universe — confirms that growth in the registered factory sector has been productivity-led, not jobs-led. From FY19 to FY23, gross output grew 56 percent, gross value added 43 percent, and persons engaged 14 percent (all in current prices). Make-in-India and the Production-Linked Incentive scheme produced output and capital deepening; they did not produce factory jobs at the rate the political narrative implies.
The unemployment headline of 3.2 percent reads very differently when disaggregated. Azim Premji University's State of Working India 2023, which re-analyses PLFS unit-level data, puts unemployment among graduates under 25 at 42 percent. This is conceptually compatible with the low headline rate because PLFS counts anyone working at least one hour per week as employed, and aggregates across rural subsistence labour and urban graduate joblessness. Both numbers are in the same survey; reading only the 3.2 percent without the 42 percent flattens the educated-youth distress story.
The Naukri JobSpeak monthly hiring index confirms the IT-sector slowdown. Year-on-year (December 2024 to December 2025), hiring in the IT-Software / Services sub-index ran at +8.1 percent against an overall index growth of +13.2 percent — IT lagged the headline. EPFO formal-sector payroll additions hit 21.04 lakh new members in July 2025 (up from 20.06 lakh in May), the highest monthly addition since the post-2018 series began. Formal-sector hiring momentum and persistent agricultural stickiness coexist; the formal-sector boom does not displace the agricultural retention.
Two-source rule note: PLFS sectoral shares are cross-checked against Azim Premji's State of Working India re-analysis of the same PLFS unit-level data (which provides definitional reconciliation across rounds). Manufacturing-sector employment growth (PLFS workforce-share + ASI persons-engaged) is cross-checked against ASI value-added series. The CMIE Consumer Pyramid Household Survey, which is paid-only and not in this analysis, would give a third independent read on labour-force participation; the spec accepts the SoWI re-analysis as the published-source proxy.
Pillar 5 · Emigration
A shift up the skill ladder
The United Nations Department of Economic and Social Affairs (UN-DESA) records 18.5 million Indians living abroad as first-generation migrants in 2024. India's Ministry of External Affairs, in its January 2025 statement, puts the broader Indian diaspora — non-resident Indian citizens plus persons of Indian origin who are foreign citizens of Indian descent — at 34.4 million. The two numbers measure different concepts and are not in conflict.
Cumulative formal renunciations of Indian citizenship totalled 1.71 million across 2014–2024 (1,710,890 across the eleven years, computed from MEA Lok Sabha replies). The 2024 figure alone, cross-validated across four parliamentary replies, was 206,378. India does not allow dual citizenship, so renunciation is a lower-bound measure: it counts only people who formally gave up Indian citizenship, not those who emigrated long-term but kept their Indian passport. The Henley Private Wealth Migration Report estimates the high-net-worth subset at 5,100 net departures in 2023, 4,300 in 2024, and 3,500 in 2025.
The compositional shift is the bigger story. Through the eMigrate portal (which handles emigration clearances for ECR-passport workers, mostly Gulf-bound unskilled labour), annual clearances collapsed from 805,000 in 2014 to 361,000 by January–November 2017, and have not recovered. Over the same window, Indian student and skilled-work visas to Canada, the United Kingdom, the United States, and Australia rose sharply in the receiving-country administrative records. India's emigration is moving up the skill ladder.
The MEA renunciation figures and the OECD's International Migration Outlook 2024 reconcile reasonably well. MEA renunciations in 2022 totalled 225,620; OECD-recorded acquisitions of OECD-member nationality by Indians in 2022 totalled 201,123 — an 89 percent concordance. The residual 24,000 is largely accounted for by acquisitions in non-OECD destinations (Singapore, the United Arab Emirates Golden Visa programme, Israel, and the Gulf).
Two-source rule note: Renunciation 2022 = 225,620 (MEA Lok Sabha primary) reconciles to OECD acquisitions B.6 = 201,123 (multilateral) at 89 percent concordance. The MEA diaspora total of 34.4 million (NRI + PIO including second/third generation) is conceptually distinct from the UN-DESA first-generation migrant stock of 18.5 million; the project's emigration corridor table preserves both side-by-side and cross-references the receiving-country administrative records (USCIS, IRCC Canada, UK Home Office, DHA Australia).
Three Tensions
Three tensions in the data
Read together, the five pillars produce three tensions that do not collapse into a single story. Each is grounded in two or more independent sources and sharpens a different question about what the term "middle class" describes in India today.
Tension 1 The K-shaped recovery
Aggregate-up consumption versus concentration-up income
The World Bank's consumption-poverty headcount fell sharply — extreme poverty from 16.2 percent to 2.3 percent over 2011–12 to 2022–23. Independent income-and-wealth concentration measures from the World Inequality Lab (Bharti, Chancel, Piketty and Somanchi 2024) report top-1 percent income share at 22.6 percent and wealth share at 40.1 percent — described in their paper as the highest historical levels. Both can be true: a rising tide lifting everyone unequally. The K-shaped recovery is real, and the "middle class" lives somewhere between the lifting bottom and the diverging top. The WID figures are contested by Panagariya, Bhalla and others on the tax-extrapolation methodology — the dispute is part of the framing, not separate from it.
Tension 2 Stock vs flow
Deepening financial inclusion or precarious over-leveraging?
India's household debt at 41 percent of GDP is low by emerging-market standards (Thailand 88 percent, Malaysia 70 percent, China 60 percent). The composition, however, is shifting fast: consumption-purpose loans are now 46 percent of household borrowing, gold loans grew at triple-digit annual rates through 2025, and net household financial savings touched a five-decade low. Simultaneously, mutual-fund investor counts more than doubled, SIP inflows nearly doubled, and CIBIL data show the gold-loan share of retail credit nearly doubling. The same flows could mean healthy financial inclusion (formerly informal-sector borrowers entering the formal credit system) or precarious over-leveraging (households substituting debt for stagnant income growth). The data does not yet allow a clean decomposition, and any reading that picks one without naming the other is selecting evidence.
Tension 3 Boom vs stagnation
A hyper-financialised middle class on top of a stagnant labour market
Mutual-fund assets tripled in five years. Demat accounts went from 4.1 crore to 21 crore. SIP inflows nearly doubled. UPI transactions reached 18,587 crore in FY25. Meanwhile, agriculture's share of the workforce rose from 42.5 percent to 46.1 percent over the same window, manufacturing's share stayed flat at 11–12 percent, and graduate-under-25 unemployment ran at 42 percent. The financialisation pillar and the labour pillar are telling parallel-but-disconnected stories. The middle class that participates in markets is not the same middle class — or even the same household members — that the labour data describes. Financial deepening without structural transformation is a real possibility; the evidence so far suggests India is doing both at once, and the disconnect is the story.
Timeline
2014–2026 across the five pillars
2014
PMJDY launched; first NDA government takes office
Pradhan Mantri Jan Dhan Yojana brought tens of crores of households into the formal banking system, enabling later digital-payment scaling. eMigrate ECR-passport clearances peak at 805,000 (mostly Gulf-bound).
2016
Demonetisation (November)
86 percent of currency in circulation withdrawn overnight. Long-running effects on cash-intensive informal sector employment and on digital payments adoption.
2017
Goods and Services Tax (July)
Indirect tax unification. UPI begins to scale meaningfully through 2017–18. eMigrate ECR clearances down to 361,000 (Jan–Nov), a 55 percent fall from 2014.
2020
COVID lockdown shock
Pew records 32M Indians dropping out of the middle class, 75M into poverty. Agriculture's share of the workforce spikes to 46.5 percent on reverse migration. PMGKAY free-foodgrain programme launched, eventually covering ~80 crore beneficiaries.
Weekly-product rationalisation, intraday position-limit monitoring, contract-size increases. Quarterly F&O trader count drops 30 percent over the next two quarters, concentrated at the smallest-trader end.
2025 (Aug)
SEBI Annual Report 2024–25 published
Industry MF AUM ₹65.7 lakh crore; unique investors 5.42 crore; Tier-3 cities the largest investor share. SEBI publishes the July 2025 EDS-vs-Cash study confirming the 91 percent loss-share for FY25 individual F&O traders.
2025 (Dec)
RBI Financial Stability Report December 2025
Household debt 41.3 percent of GDP. Non-housing retail loans 55 percent of household borrowings. Asset-price share of post-COVID financial-wealth gain = 30.5 percent. EM peer comparison published. SEBI Investor Survey 2025 (released Jan 2026) reports household securities-market participation at 9.5 percent.
Methodology & limitations
How the evidence was assembled
The window 2014–2026 begins with the launch of Pradhan Mantri Jan Dhan Yojana (the financial-inclusion programme that brought tens of crores of households into the formal banking system) and runs through demonetisation (November 2016), GST (July 2017), the Insolvency and Bankruptcy Code, the COVID lockdown shock, the scaling of the Unified Payments Interface to 18,587 crore transactions in FY25, and the post-2024 wave of public-data releases that allow the period to be read with primary sources rather than press summaries.
The data are public. The Periodic Labour Force Survey (PLFS) from MoSPI; the Reserve Bank of India's Financial Stability Report (December 2025); SEBI's studies on equity derivatives (September 2024 and July 2025) and the SEBI Annual Report 2024–25; AMFI monthly statistics; the World Bank, Pew Research, the BIS; the Ministry of External Affairs parliamentary replies on emigration and the UN-DESA bilateral migrant stocks. Forty-seven datasets in total, audited end-to-end. Every headline claim is verified against at least two independent sources of different type. Where two sources disagree by definition (the BIS measure of household debt and the RBI measure differ by 3.5 percentage points because BIS counts a wider set of lenders), the gap is preserved and explained rather than averaged.
What this analysis does not claim
The PRICE ICE 360 survey is the only Indian source that measures the ₹5–30 lakh middle-class income band directly across waves; this analysis does not have direct access to the PRICE microdata. Pew issued no India follow-up after the March 2021 release, so no source replicates the Pew middle-income-band trajectory after 2020. The HCES 2017–18 round was suppressed and never released, leaving an eleven-year gap (2011–12 to 2022–23) with a methodology break in the middle. CMIE Consumer Pyramid Household Survey access is paid-only and not used here; the Azim Premji State of Working India re-analyses serve as the published-source substitute. PLFS unit-level microdata is registration-walled (PAN/Aadhaar verification), so only the published PLFS reports are drawn on.
The analysis is descriptive, not causal. The rise in the agricultural workforce share is partly a COVID reverse-migration spike and partly a structural pattern that pre-existed it; the data do not separate the two cleanly at the unit level. The rise in household debt is partly distress and partly formalisation; the data do not separate those cleanly either. The financialisation-versus-labour-market disconnect (Tension 3) is described, not attributed.
Glossary & abbreviations
Plain English on every acronym used above
Statistical agencies & surveys
MoSPI / NSOMinistry of Statistics and Programme Implementation; the National Statistical Office is its statistical wing.
PLFSPeriodic Labour Force Survey. Annual survey of employment and labour-force participation, MoSPI.
PS+SSPrincipal-Status plus Subsidiary-Status. PLFS uses this as the headline employment definition. Counts anyone working ≥ 1 hour per week as employed.
HCESHousehold Consumer Expenditure Survey, MoSPI. Five-yearly survey of household consumption.
MMRPModified Mixed Reference Period. The 2022–23 HCES recall convention; not directly comparable to the URP/MRP convention used in 2011–12.
SEBISecurities and Exchange Board of India. Capital-markets regulator.
RBIReserve Bank of India. Central bank.
FSRFinancial Stability Report, RBI. Semi-annual.
AMFIAssociation of Mutual Funds in India. Industry body.
CDSL / NSDLCentral Depository Services Limited / National Securities Depository Limited. The two depositories that hold demat accounts.
EPFOEmployees' Provident Fund Organisation. Manages formal-sector retirement contributions.
Multilateral & international
BISBank for International Settlements. Publishes cross-country household-debt comparisons.
NPISHsNon-Profit Institutions Serving Households. The "household sector" in BIS measures includes them; RBI does not.
World Bank, LMICLower-Middle-Income Country. The $4.20-a-day (2021 PPP) WB poverty line.
PPPPurchasing Power Parity. Adjusts for cost-of-living differences across countries.
UN-DESAUnited Nations Department of Economic and Social Affairs. Publishes bilateral migrant-stock estimates.
OECD IMOOrganisation for Economic Co-operation and Development, International Migration Outlook. Annual.
IOMInternational Organization for Migration. Publishes the World Migration Report.
USCIS, IRCC, UKHO, DHAUnited States Citizenship and Immigration Services; Immigration, Refugees and Citizenship Canada; UK Home Office; Australian Department of Home Affairs. The four host-country sources of administrative migration data used here.
WID.worldWorld Inequality Database. Houses the Bharti-Chancel-Piketty-Somanchi 2024 working paper on Indian income and wealth concentration.
Class, market & programme terms
F&OFutures and Options. Derivative contracts on indexes or stocks; offer leveraged exposure. Concentrated on NSE index options.
SIPSystematic Investment Plan. Monthly contribution to a mutual-fund scheme.
AUM / AAUMAssets Under Management (point-in-time) / Average Assets Under Management (period average).
DematDematerialised securities account. Required to hold equities or many other securities digitally.
NCCS A / B / C / D / ENew Consumer Classification System. A marketing-research socio-economic classification used by the SEBI Investor Survey 2025; A is the highest, E the lowest.
Tier 1 / 2 / 3 citiesIndian-city classification by population. Tier 1 = large metros; Tier 3 = smaller cities. SEBI Investor Survey reports investor counts across these tiers.
B30"Beyond Top 30" cities. Used by the mutual-fund and broking industry to track penetration outside the largest 30.
SCB / NBFC / HFCScheduled Commercial Bank / Non-Banking Financial Company / Housing Finance Company. The three lender types in the RBI's narrow household-debt aggregate.
PMGKAYPradhan Mantri Garib Kalyan Anna Yojana. Free-foodgrain programme launched 2020, covering ~80 crore beneficiaries; extended for five years from January 2024.
PMJDYPradhan Mantri Jan Dhan Yojana. The 2014 financial-inclusion programme that brought tens of crores of households into the formal banking system.
UPIUnified Payments Interface. India's instant inter-bank digital payments rail. 18,587 crore transactions in FY25.
ECR / eMigrateEmigration Check Required passports / the MEA's emigration-clearance portal for ECR workers (mostly Gulf-bound unskilled labour).
NRI / PIONon-Resident Indian (Indian citizen abroad) / Person of Indian Origin (foreign citizen of Indian descent, often second/third generation). MEA's diaspora total includes both.
NABARD All India Rural Financial Inclusion Survey 2021–22PIB release Oct 2024.
Bharti, Chancel, Piketty, Somanchi (WID.world 2024)WID Working Paper 2024-09 · pushback on methodology by Panagariya, Bhalla et al.
Subramanian (2024); Anand (2024); Ghatak & Kumar (2024); Drèze & SomanchiIndependent reconstructions of HCES rounds, in The India Forum and Ideas for India.
Household debt (Pillar 2)
RBI Financial Stability Report December 2025Chapter I.3.2 Household Sector. rbi.org.in/FsReports
Project repositoryForty-seven validated Parquets, fifteen comparability-break entries, full SPEC.md, definitions.yaml, fact-check audit, and Gemini editorial-review report. Available on request.
Two-source-rule auditEvery headline claim verified against at least two independent sources of different type. Where definitional differences exist (BIS vs RBI on household debt; MEA vs UN-DESA on diaspora), gaps are preserved side-by-side, never averaged.
Editorial reviewIndependent Gemini Pro 2.5 editorial review applied: PMGKAY counter-narrative added to Pillar 1; MoF physical-savings rebuttal added to Pillar 2; WID methodology dispute documented; ASI organised-vs-unorganised distinction made explicit; framing of T2b corrected.
AI-assisted production note. Data acquisition, code generation, figure rendering, and prose drafting were AI-assisted (Claude Opus 4.7) under the author's direction. Three independent agents performed (i) cross-Parquet fact-checking, (ii) editorial review by Google Gemini Pro 2.5, and (iii) structural review against the existing profscm.com page conventions. Five major numerical errors flagged in the fact-check were corrected prior to publication; substantive editorial revisions (PMGKAY, Ministry of Finance rebuttal, WID methodology dispute, organised-vs-unorganised manufacturing distinction, framing inversion on the asset-price decomposition) were applied in response to the editorial review. Final responsibility for the analysis and any remaining errors is the author's.