Home · Research · Pleasant Prairie at an Inflection Point
Community Research · Kenosha
Contribution to the 2035 Comprehensive Plan · April 2026
Pleasant Prairie at an Inflection Point
Dr. Pritosh Kumar · Assistant Professor of Supply Chain Management · University of Wisconsin–ParksideLast updated: April 2026Data current through 2025
A data summary for the Village of Pleasant Prairie 2035 Comprehensive Plan process. We bring together public data from seven sources to document how the Village's tax base composition, workforce geography, and housing affordability have moved over the past fifteen years. The goal is to put a common factual baseline on the table, not to prescribe policy.
Sources: WI Department of Revenue, US Census LEHD LODES, BLS QCEW, Zillow Research, the WI State Cartographer's Office, WisDOT, and the US Census Bureau ACS. Offered as an independent academic reference for the Village's current 2035 Comprehensive Plan and the successor planning cycle.
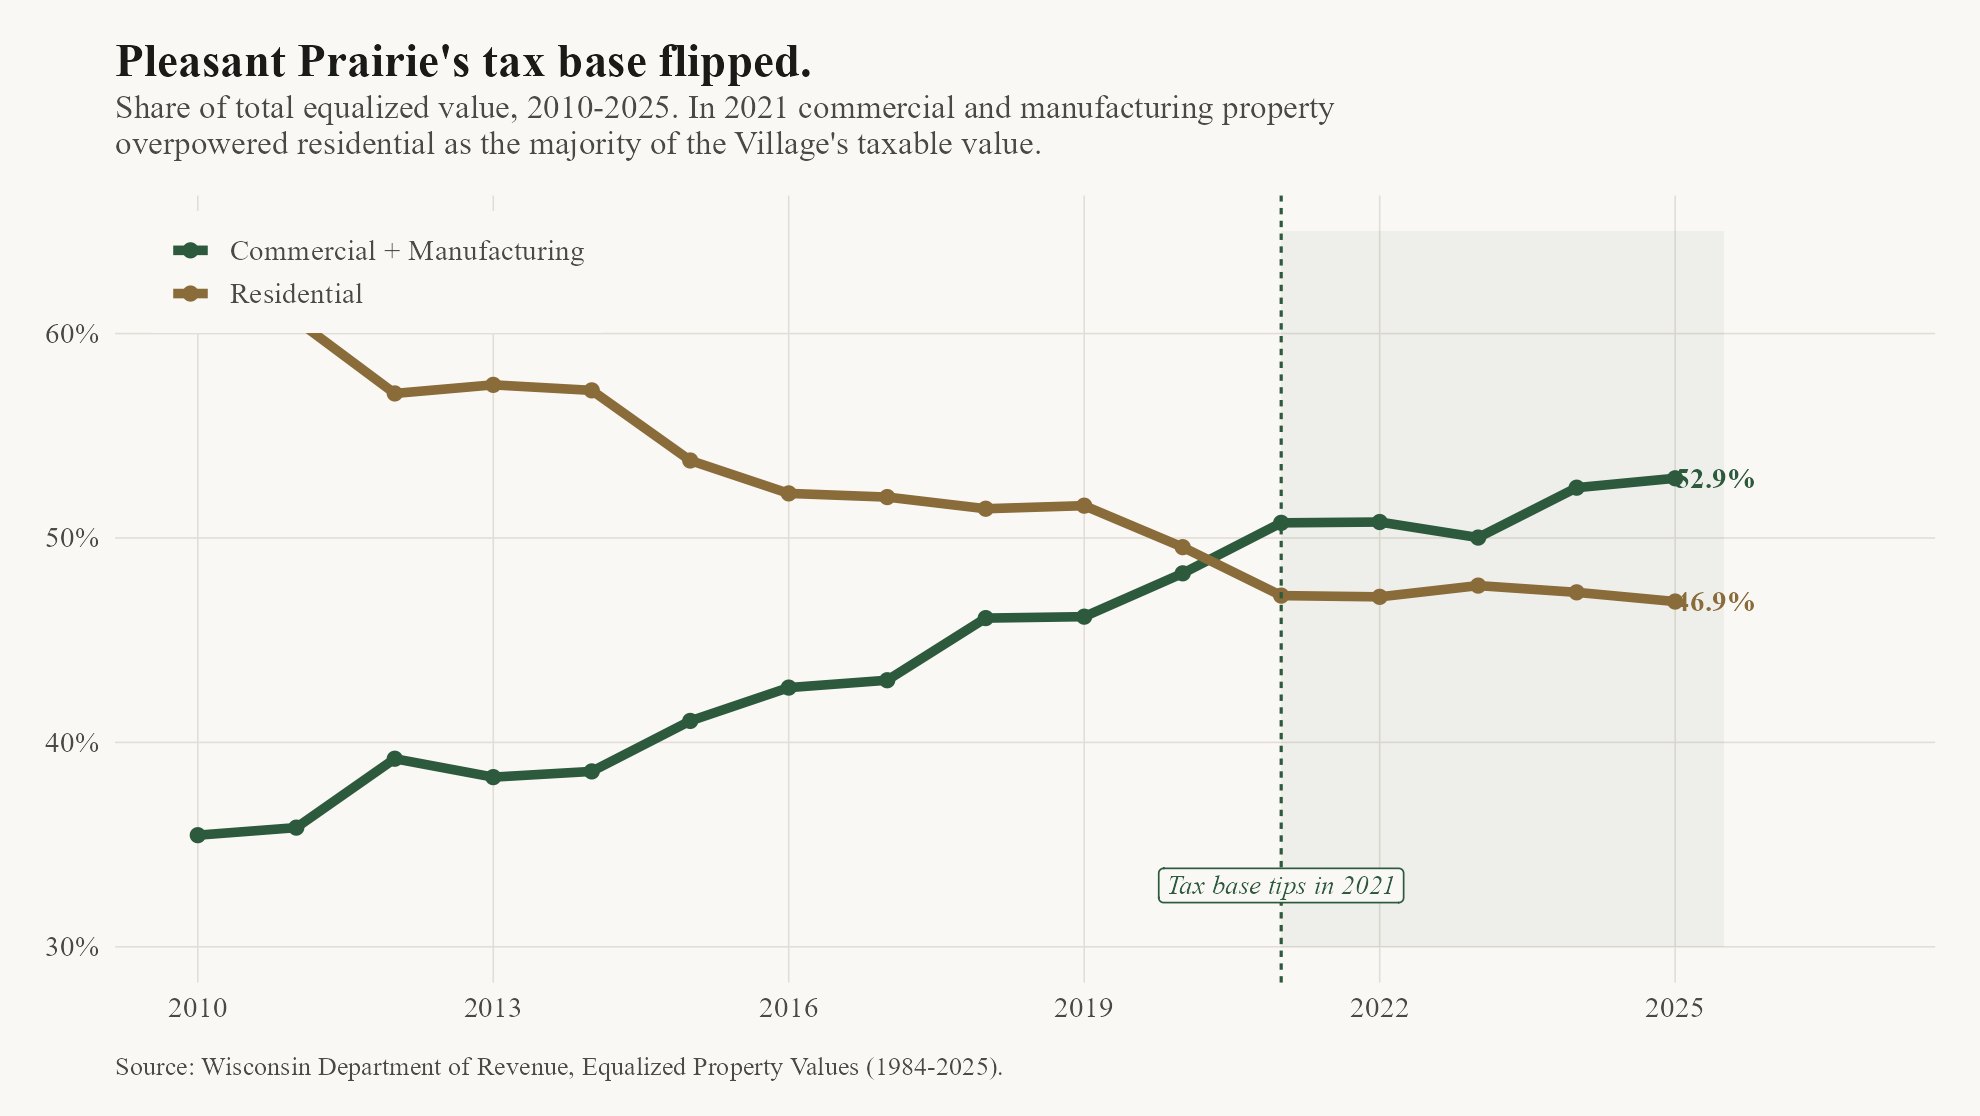
Pleasant Prairie, WI · Share of total equalized value by property class · 2010-2025
In 2010, residential property made up 61 percent of the Village of Pleasant Prairie's equalized value, and commercial and manufacturing property together made up 36 percent. By 2025 those shares were effectively reversed: residential 47 percent, commercial + manufacturing 53 percent. The two series first crossed in 2021.
The crossing is not sharp. Pleasant Prairie's commercial + manufacturing share was 50.7 percent in 2021, 50.8 percent in 2022, dipped back to exactly 50.0 percent in 2023, and then moved to 52.5 percent in 2024 and 52.9 percent in 2025. The underlying series moves gradually, not abruptly. What has moved decisively is the absolute level of industrial investment: manufacturing-class equalized value alone went from $295 million in 2018 to $633 million in 2024.
This is a descriptive change, not an interpretation. What it means for the Village's long-run tax base, workforce, and housing stock is the subject of the rest of this brief. We present the numbers and let readers draw their own conclusions.
52.9%
of Pleasant Prairie's equalized value is commercial + manufacturing
2025 · WI DOR
1.59
jobs per employed Pleasant Prairie resident
LODES 2022
8.4%
of Pleasant Prairie jobs are filled by Pleasant Prairie residents
LODES 2022
8.1×
median home value relative to warehouse worker annual pay
2024 · QCEW + Zillow
Part I
A regional pattern, not a Pleasant Prairie story alone
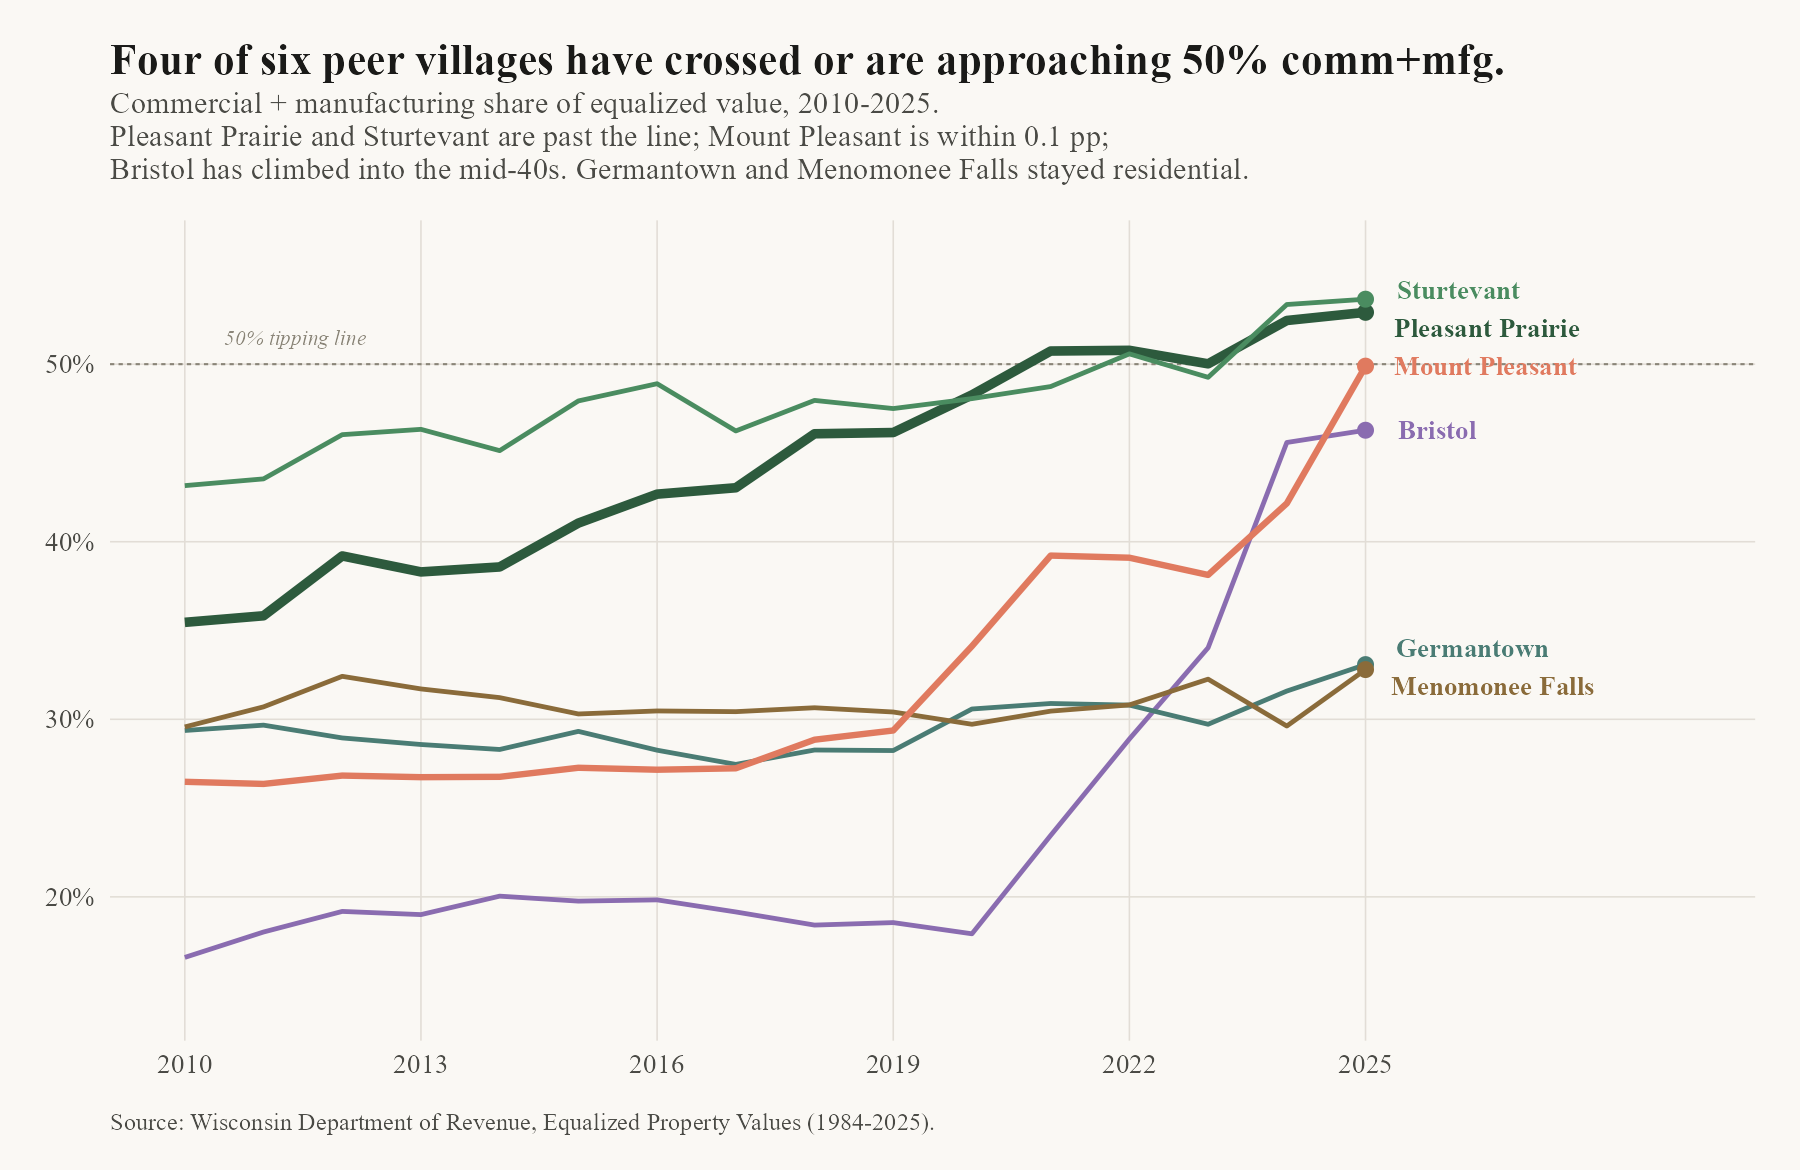
We compare Pleasant Prairie to five other Wisconsin villages along the southeast Wisconsin interstate corridor: Mount Pleasant (Racine County, home of the Foxconn / Microsoft campus), Sturtevant, Bristol, Germantown, and Menomonee Falls. All six are incorporated villages with 2020 populations between roughly 7,000 and 40,000. The selection is informal: villages a Pleasant Prairie planner might reasonably look to.
Four of the six villages have crossed or are within a percentage point of crossing the 50 percent commercial + manufacturing threshold. Pleasant Prairie and Sturtevant are above the line. Mount Pleasant is at 49.9 percent in 2025, a near-vertical move from 27 percent in 2019 driven almost entirely by the Foxconn and successor developments (classified by DOR as Commercial rather than Manufacturing). Bristol has climbed into the mid-40s on warehouse and logistics development.
Germantown and Menomonee Falls are the other regional pattern. Both started 2010 at roughly 30 percent commercial + manufacturing, the same range Pleasant Prairie occupied, and both held close to that share for the entire 2010–2025 window. The southeast Wisconsin corridor contains both trajectories.
Six southeast Wisconsin villages, 2010–2025. Pleasant Prairie, Sturtevant, and Mount Pleasant have climbed toward or past the 50 percent line; Bristol has followed more recently. Germantown and Menomonee Falls have been essentially flat.
One additional observation is worth flagging because it is not visible in the share-of-value chart. Pleasant Prairie ranks first among the six villages by commercial + manufacturing share of value, but only third by commercial + manufacturing share of land area (13.5 percent of developed acres, versus 16.8 percent for Sturtevant and 16.3 percent for Menomonee Falls). Pleasant Prairie's industrial parcels are unusually high-value per acre, reflecting the type of development the Village has attracted — data centers, distribution centers, manufacturing campuses — rather than physical extent.
Part II
Wages and home values have moved at very different rates
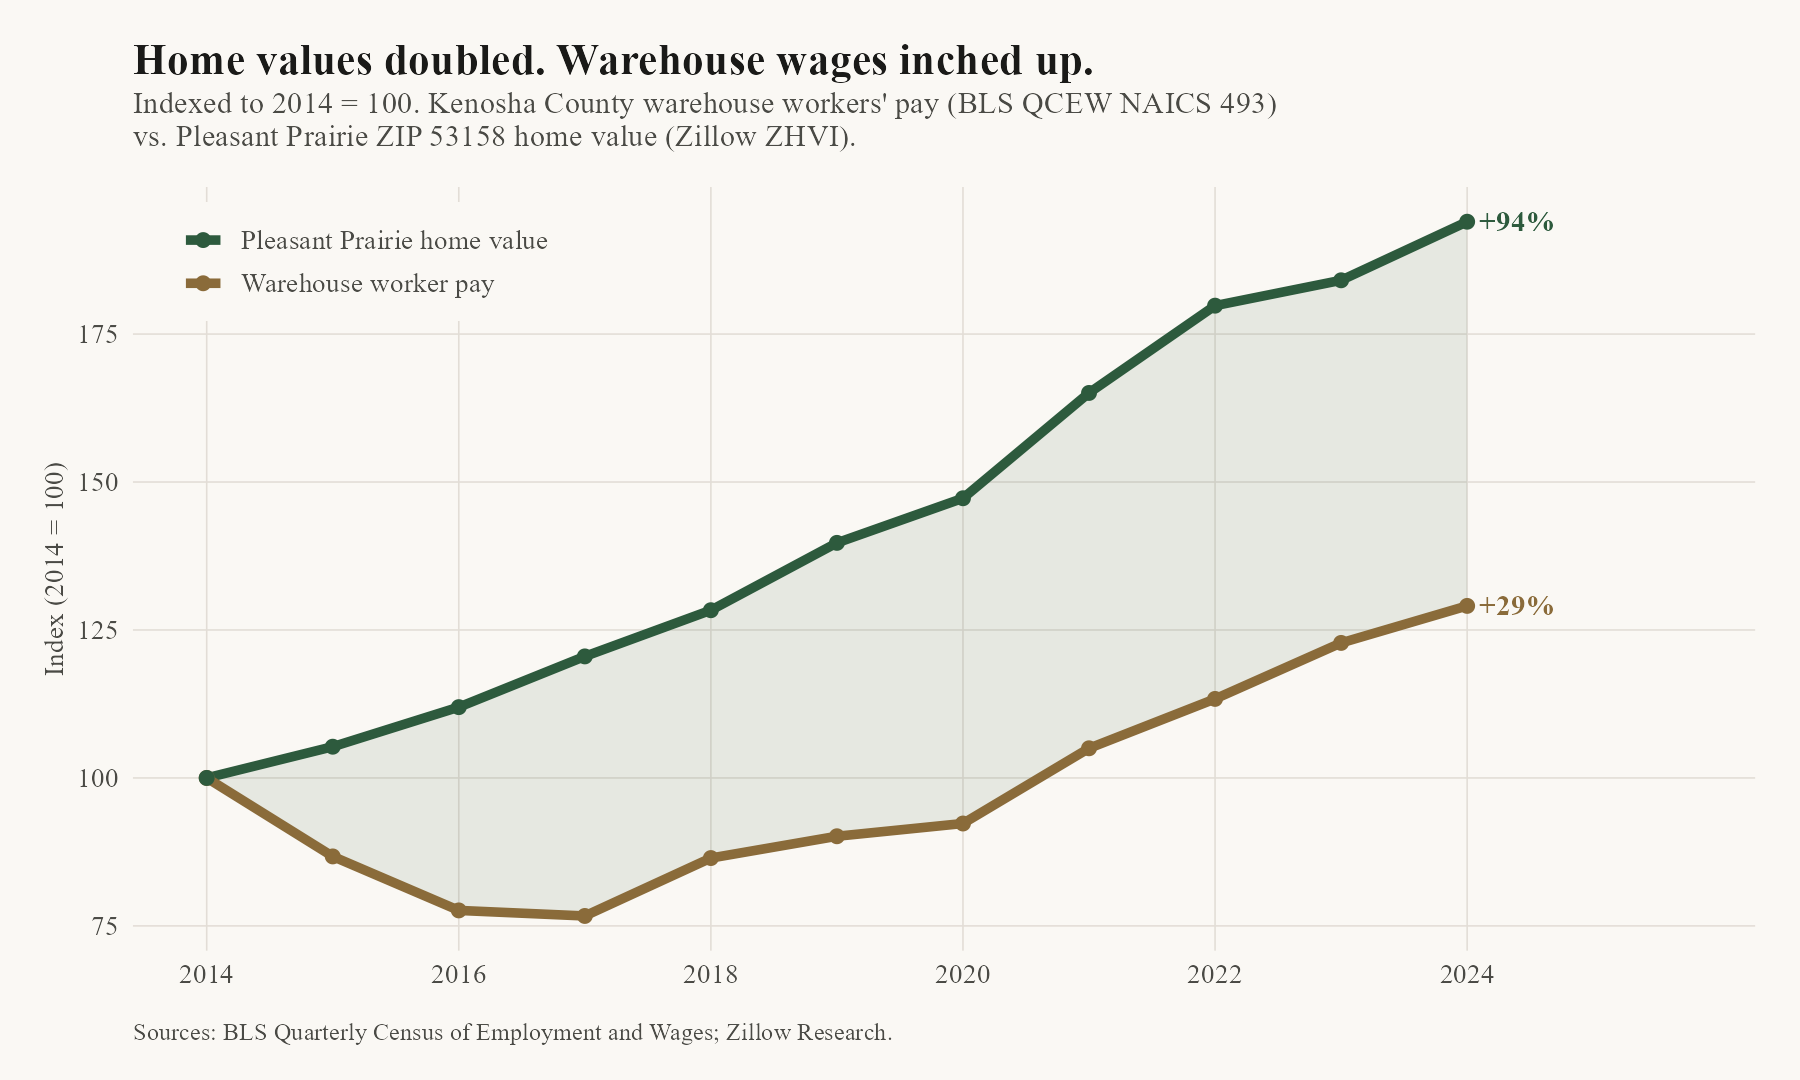
Between 2014 and 2024, the typical Pleasant Prairie home value (Zillow ZHVI for ZIP 53158, annual mean of monthlies) rose from $202,802 to $393,399, an increase of 94 percent. Over the same period, the average annual wage for Kenosha County workers in NAICS 493 (Warehousing and Storage) rose from $37,743 to $48,715, an increase of 29 percent. The chart below indexes both series to 2014 = 100.
Indexed to 2014 = 100. The shaded area is the gap between the two series.
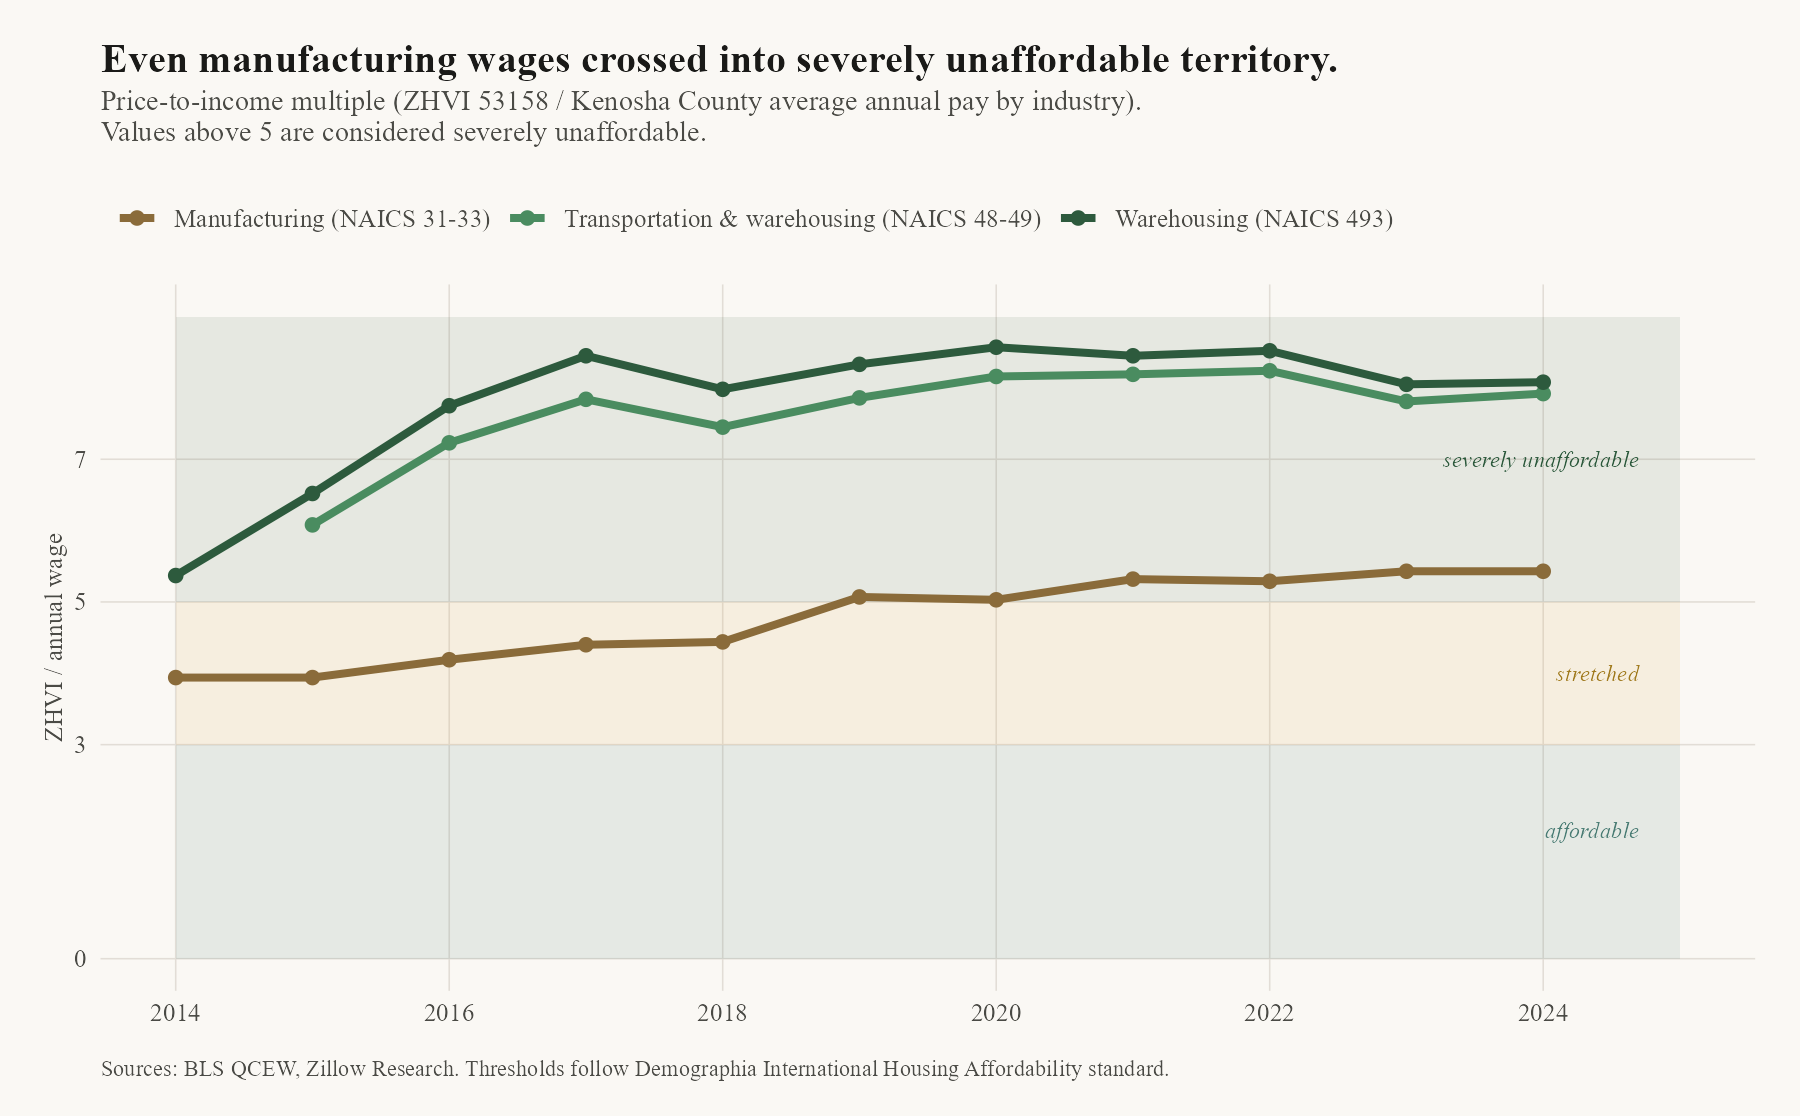
The most common summary metric for this kind of gap is the price-to-income multiple: the ratio of the median home value to the annual wage of a relevant worker group. Under the internationally used Demographia standard, a ratio of three or below is classified as affordable, three to five as moderately unaffordable or stretched, and above five as severely unaffordable. For Kenosha County's three logistics-relevant industry groups, the ratios look like this:
Demographia price-to-income categories shown as background bands. Demographia's thresholds were calibrated in a lower-interest-rate environment; in the current rate environment they are, if anything, conservative with respect to the affordability judgment.
QCEW establishment-level averages include supervisors and salaried staff alongside frontline workers, so the wage figures above are an upper bound on typical warehouse-floor pay. The price-to-income ratios for frontline workers are therefore plausibly higher than the chart suggests. At 2024 QCEW average pay, warehouse-industry workers in Kenosha County would need to spend roughly 67 percent of gross income on mortgage, property tax, and insurance to purchase a median Pleasant Prairie home at 2024 prices (assuming a 30-year fixed mortgage at 6.5 percent APR with 20 percent down, 1.8 percent effective property tax, and 0.5 percent insurance).
Warehouse employment in Kenosha County rose from 943 average annual positions in 2014 to 7,896 in 2024, an increase of roughly 8.4-fold over ten years.
Part III
Where the workforce lives
The US Census Longitudinal Employer-Household Dynamics (LODES) dataset records the home census block and the workplace census block of each job in the United States. For the 432 census blocks inside the Pleasant Prairie village boundary, LODES 2022 identifies 18,075 jobs. We can see exactly where the people filling those jobs live.
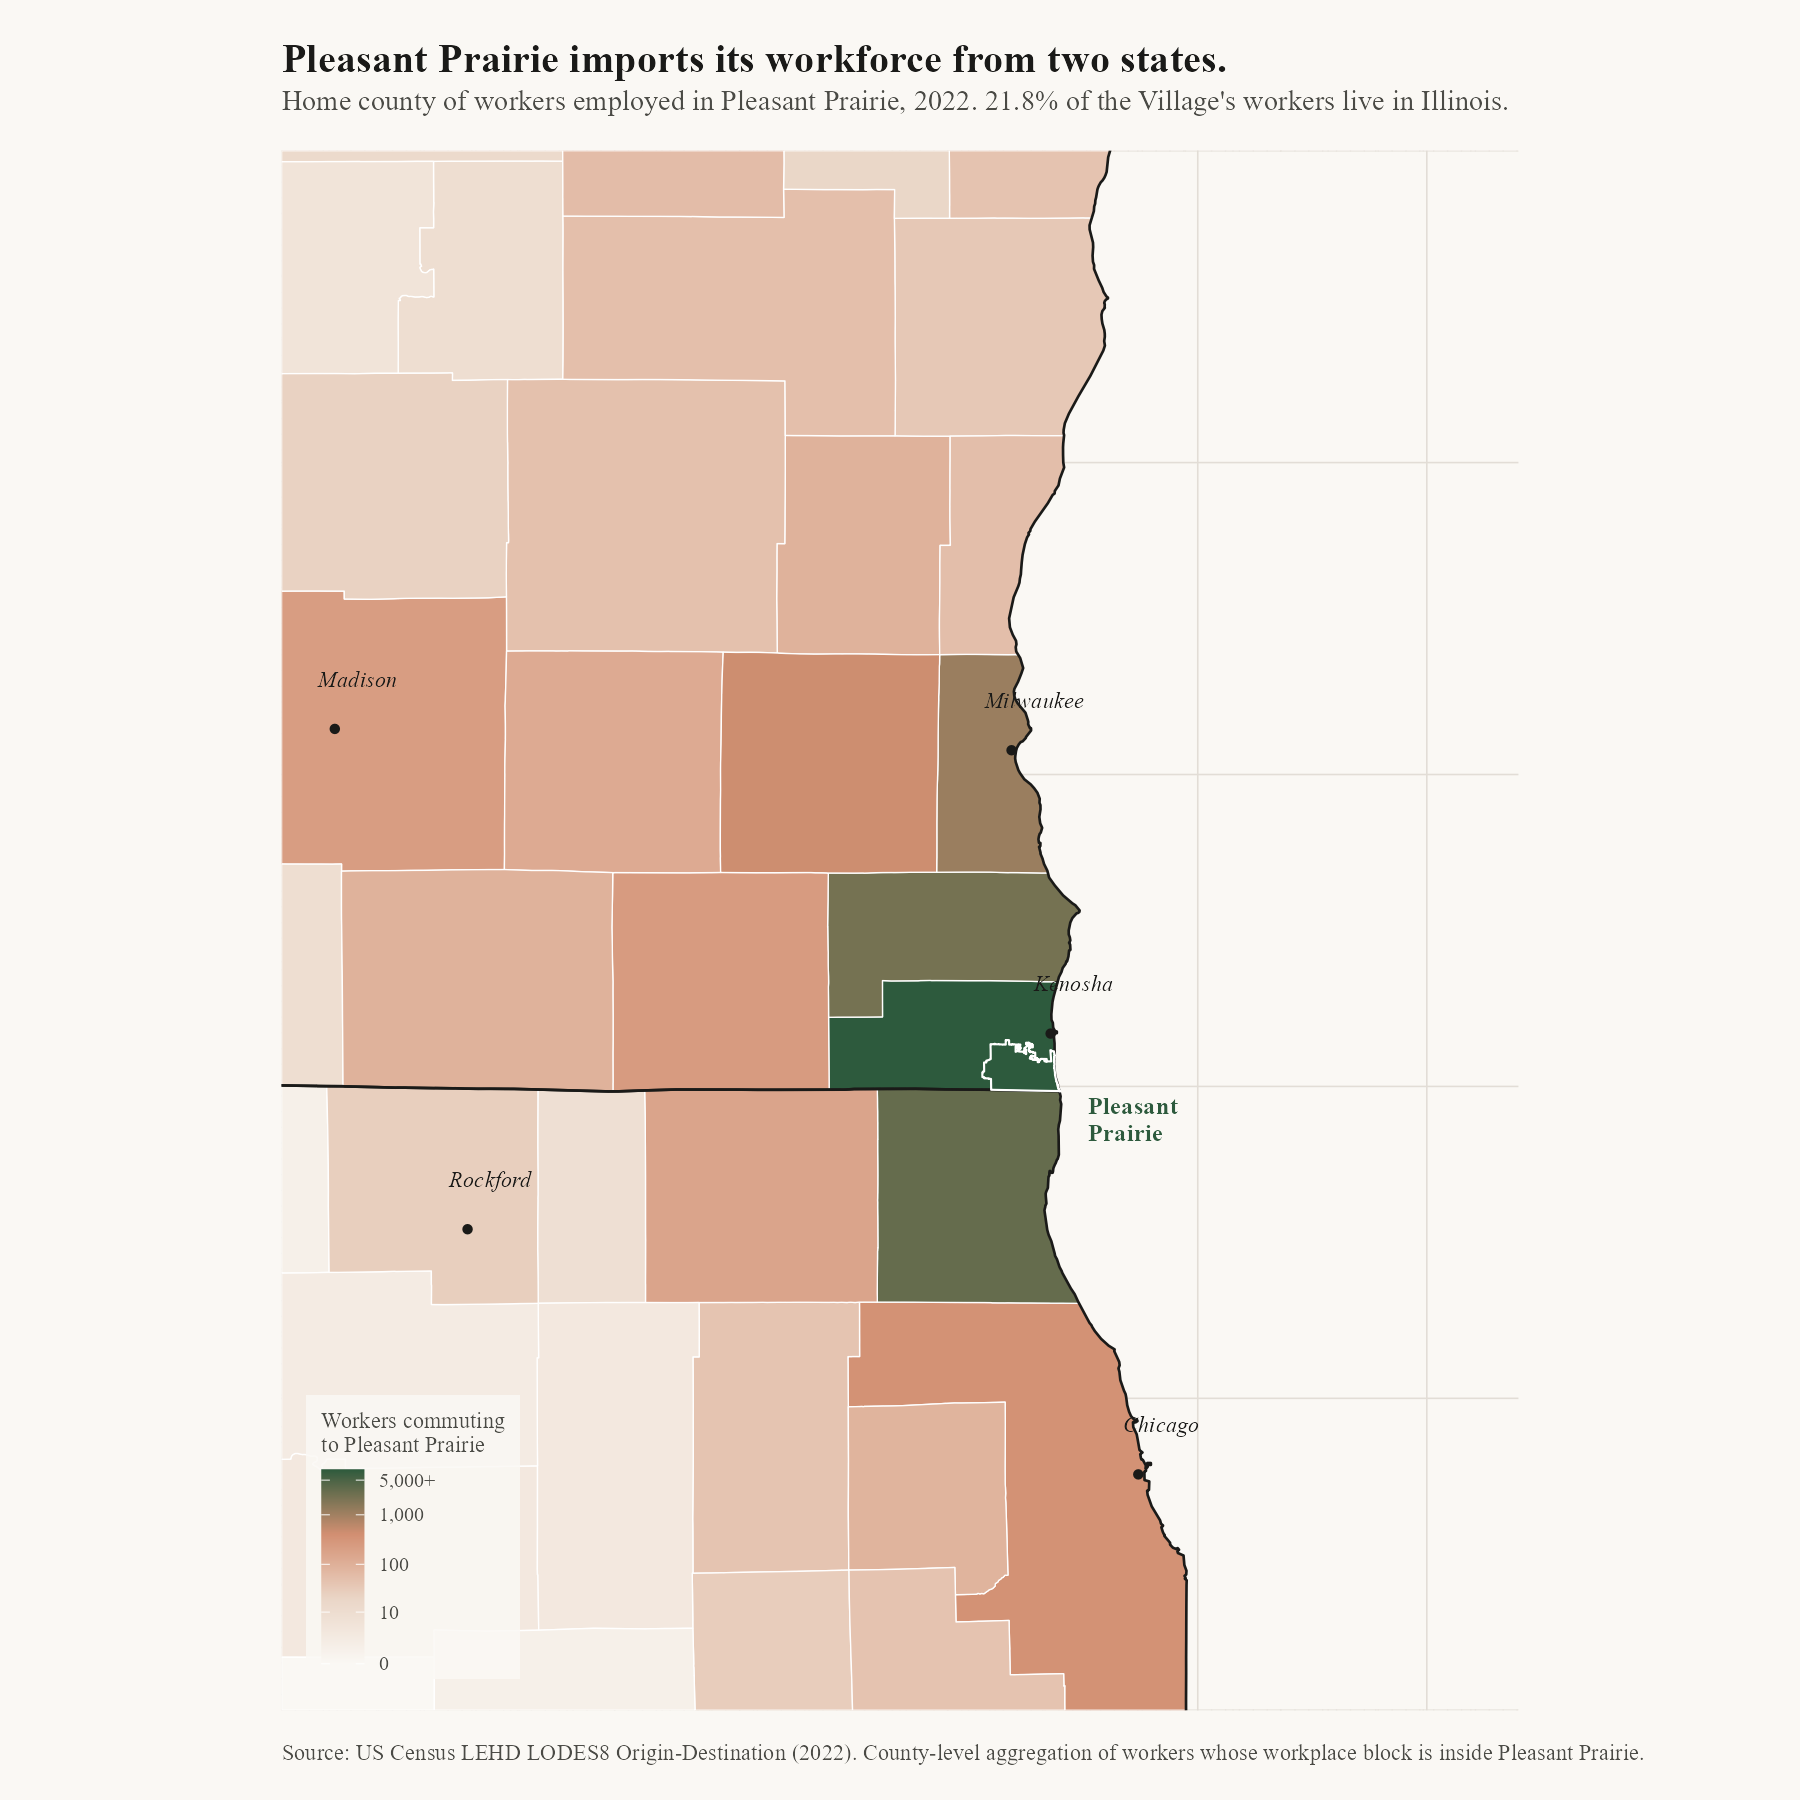
Home county of the 18,075 workers employed in Pleasant Prairie (LODES 2022). Darker counties are the origin of more workers. Kenosha County supplies the largest share; Lake County, Illinois is second.
The top four home counties for Pleasant Prairie's workforce are Kenosha County, WI (8,158 workers), Lake County, IL (3,146), Racine County, WI (2,320), and Milwaukee County, WI (1,155). Grouped by residence type: 31.2 percent of Pleasant Prairie's workers live elsewhere in Wisconsin, 28.5 percent in the City of Kenosha, 21.8 percent in Illinois, 8.4 percent in Pleasant Prairie itself, 8.3 percent in the rest of Kenosha County, and 1.9 percent in other states. The Illinois share is the most distinctive feature of the Village's commute profile; most Wisconsin villages of this size do not have a meaningful cross-state inflow.
The counts above are jobs, not unique people. LODES applies confidentiality noise at the block level, which means individual block totals can be noisy, but aggregations to the village scale are more stable. A worker with two jobs in Pleasant Prairie appears twice in the total.
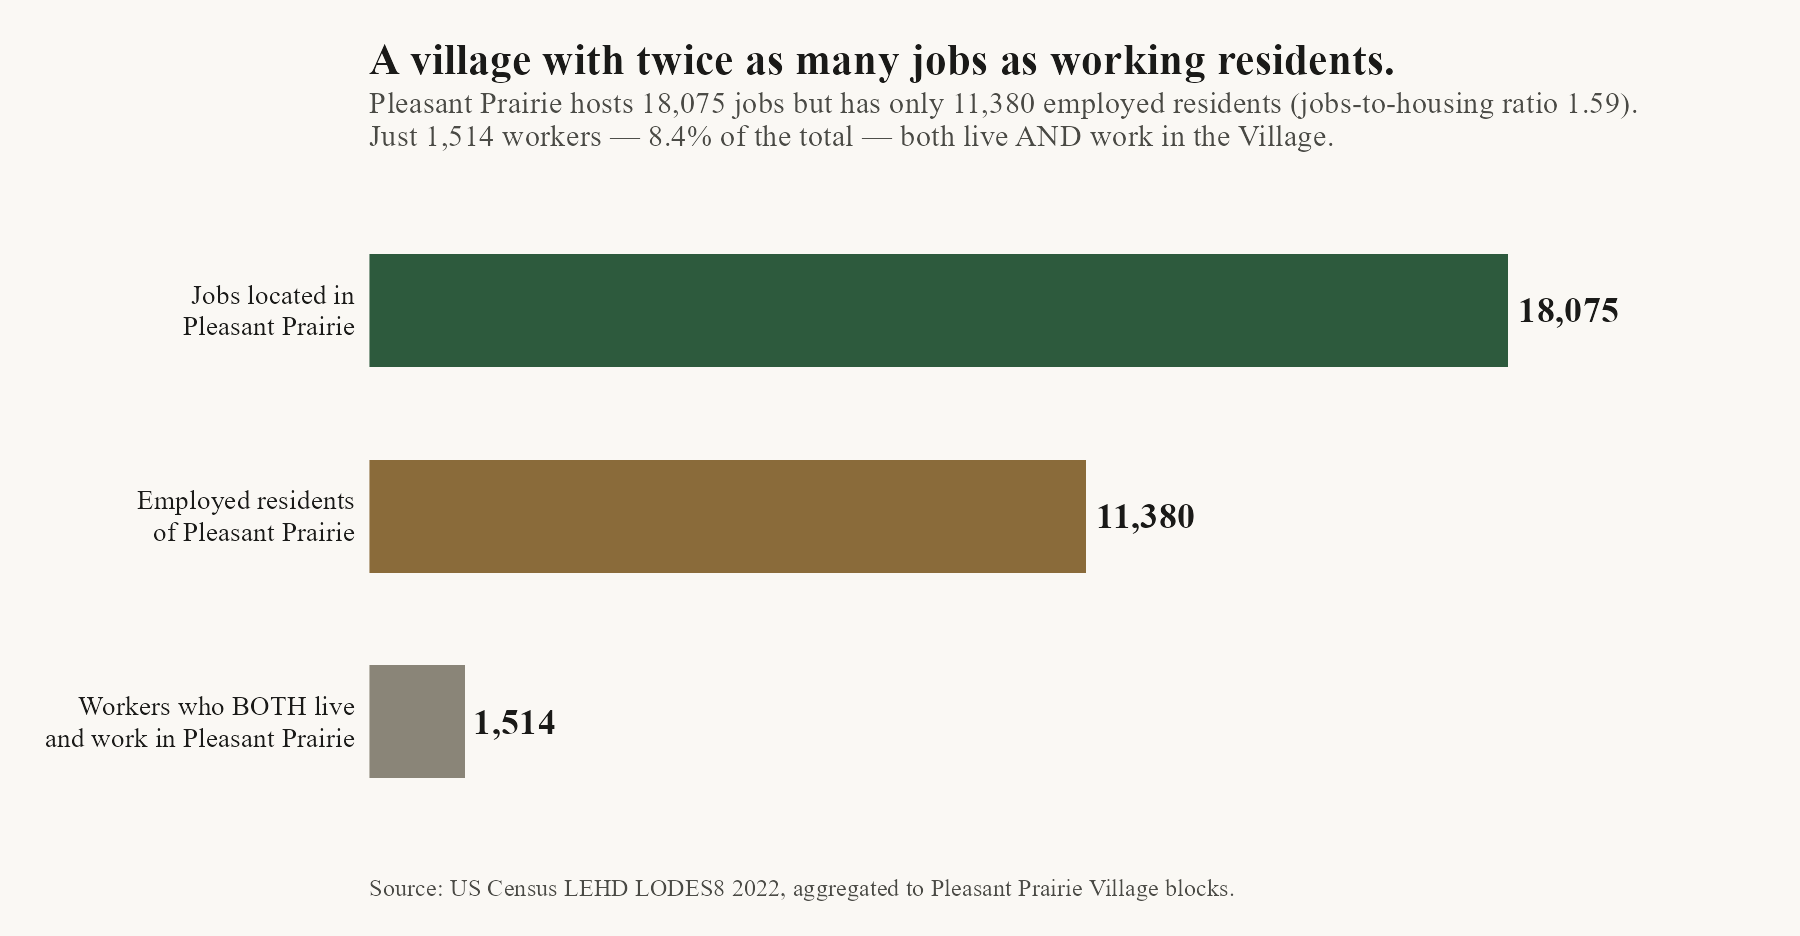
Pleasant Prairie's jobs-to-employed-residents ratio is 1.59. Of the 18,075 jobs in the Village and the 11,380 employed residents of the Village, 1,514 workers are in both groups.
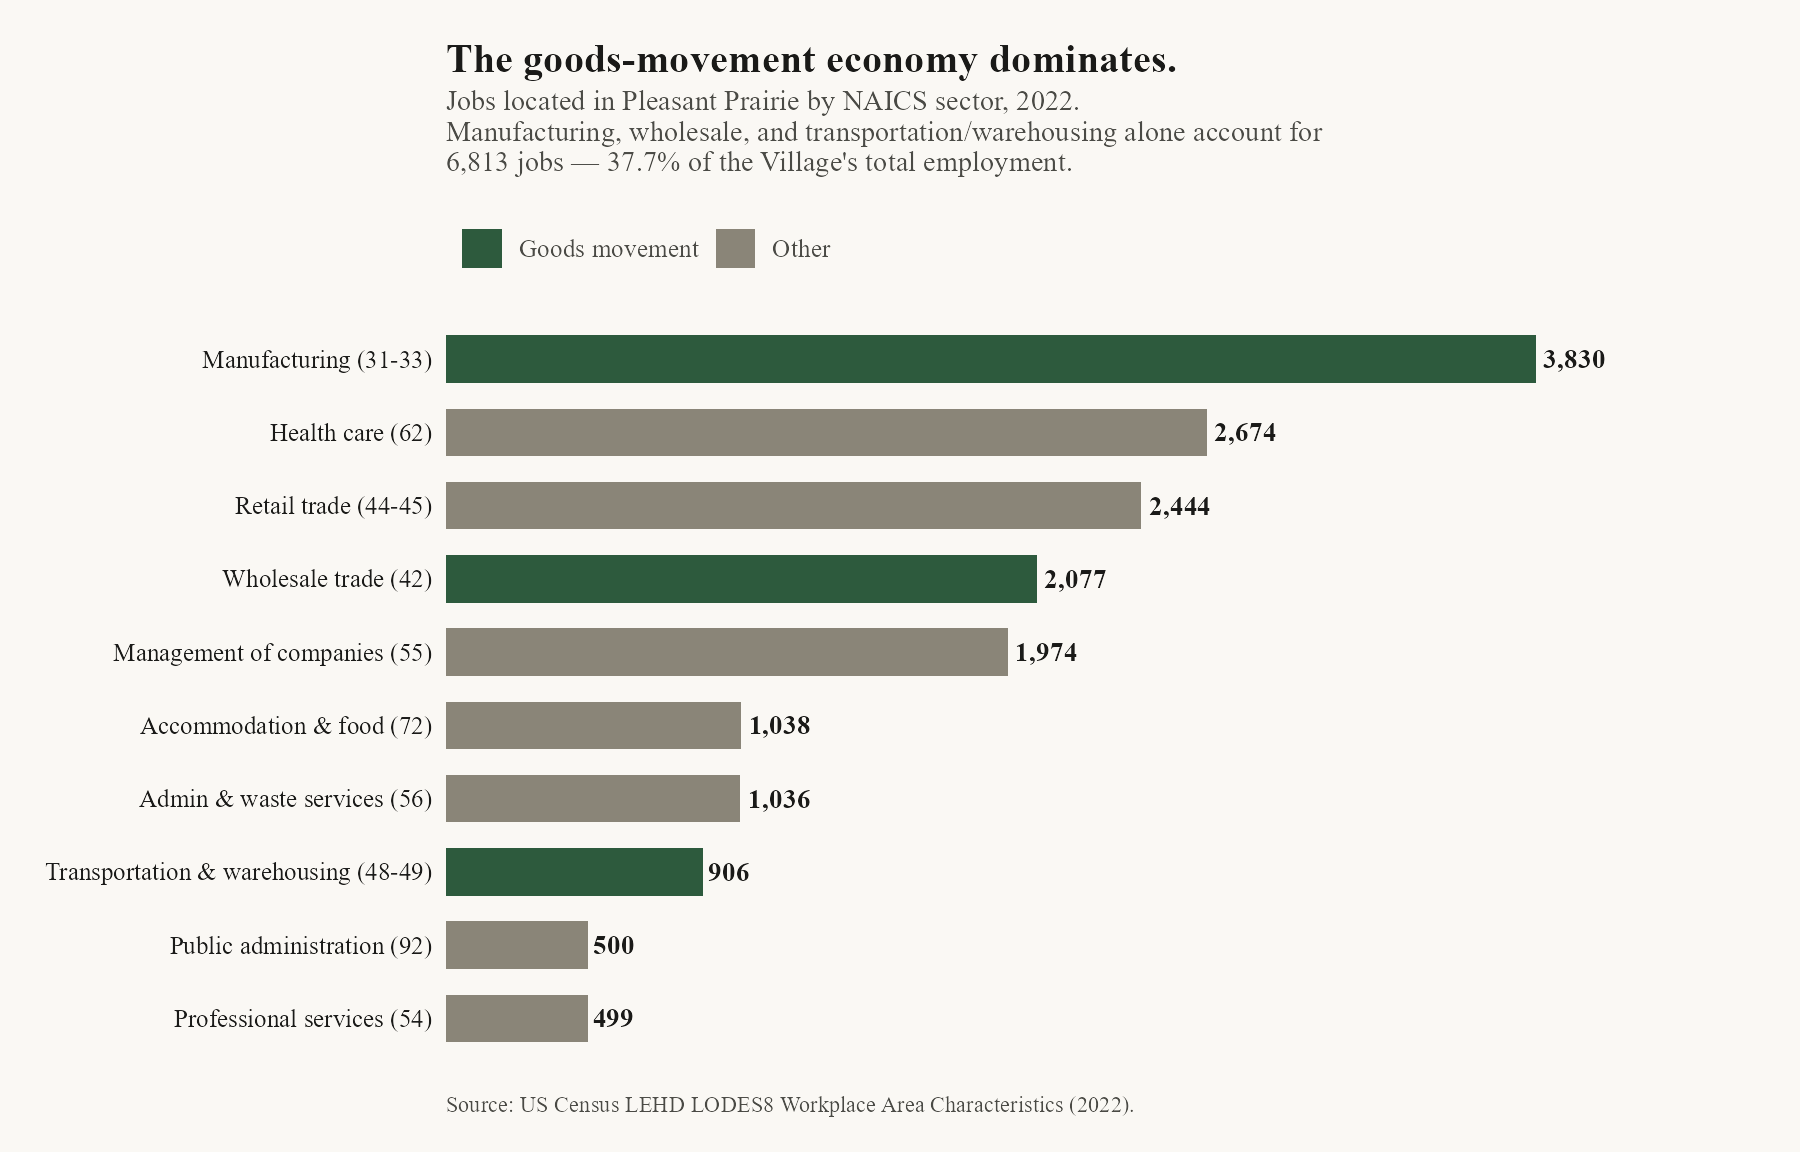
The industries doing the hiring in Pleasant Prairie are concentrated in goods movement. Manufacturing, wholesale trade, and transportation + warehousing together account for 6,813 jobs — 37.7 percent of the Village's total employment. Healthcare and retail are the next largest sectors.
Top ten industry sectors by job count, Pleasant Prairie workplace, 2022. Sectors shaded in the accent color form the goods-movement group.
Part IV
Traffic load on the corridor
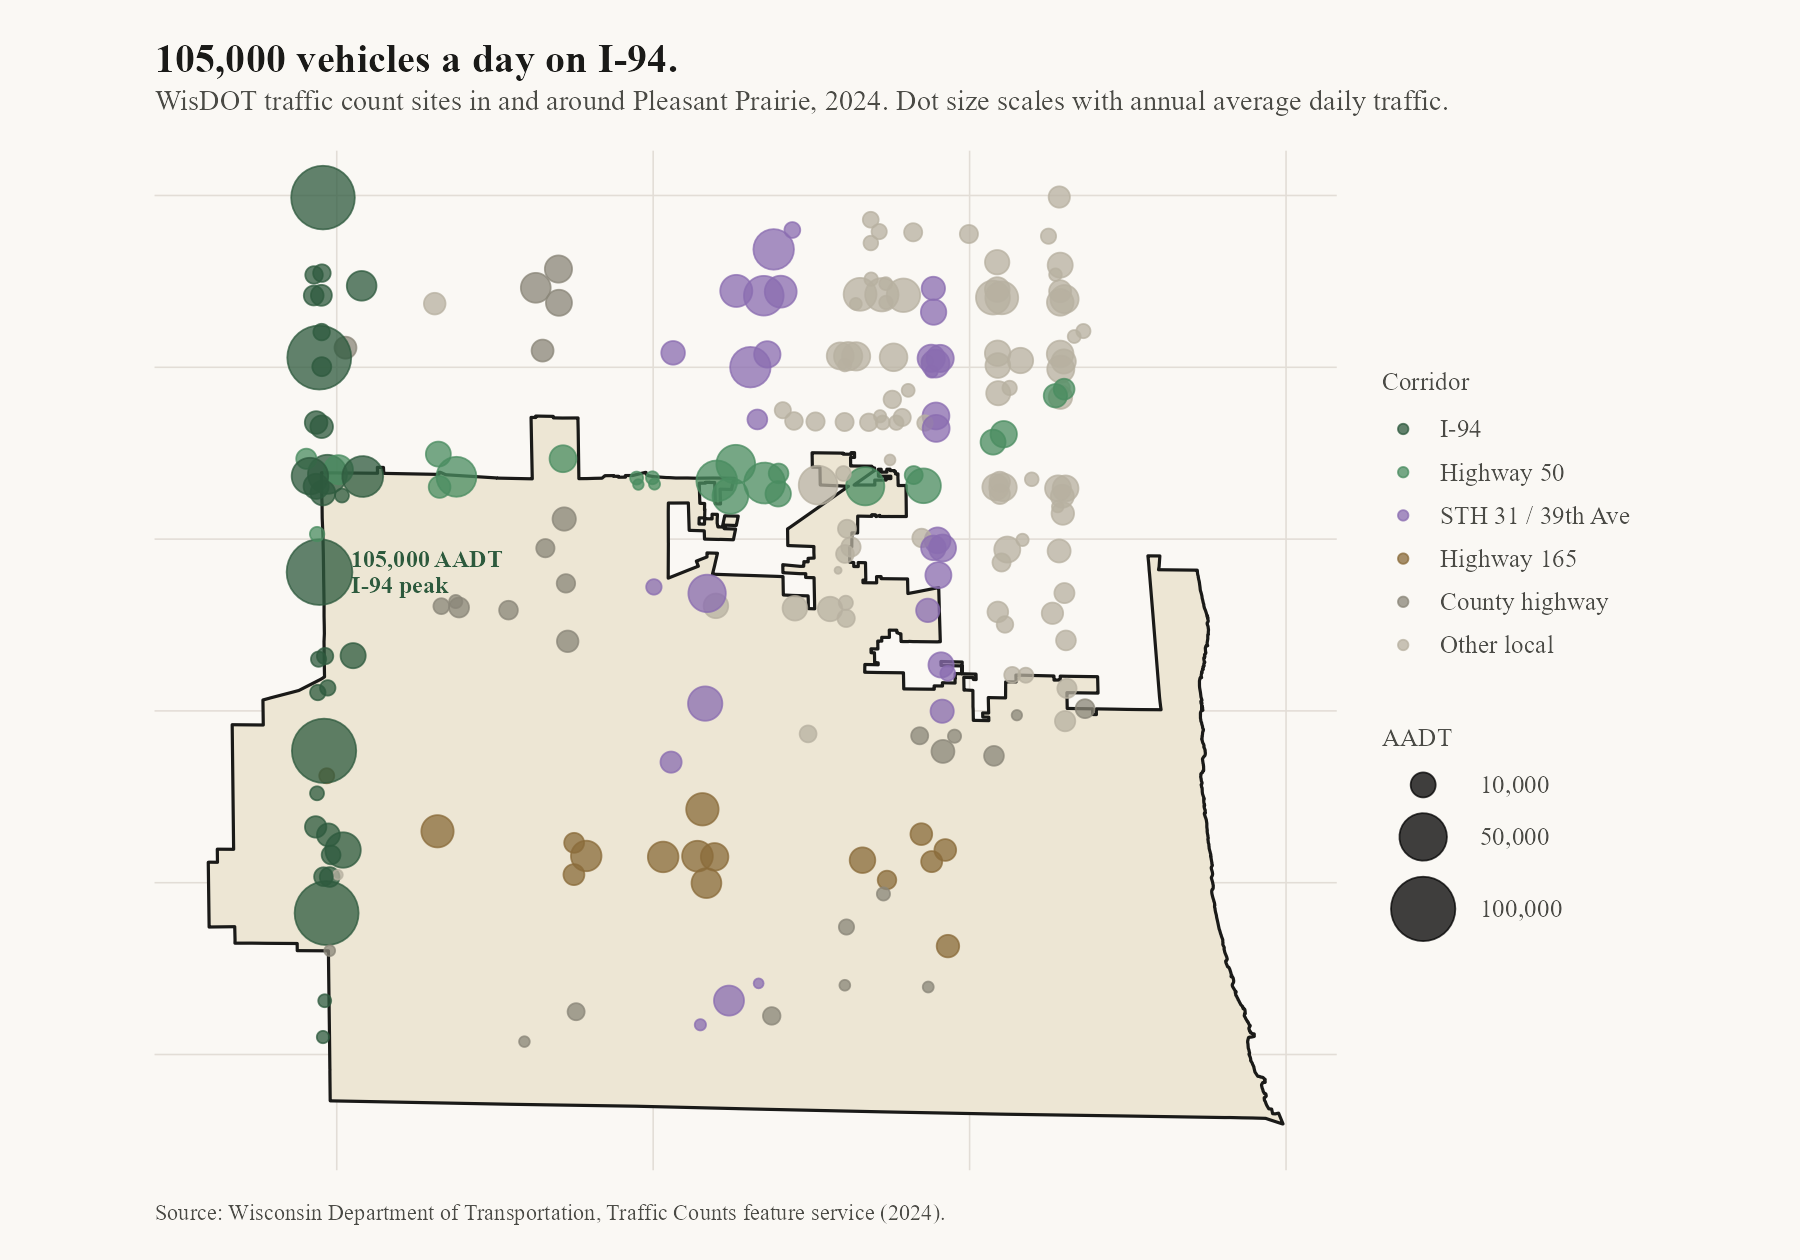
A commuter inflow of this size shows up in the WisDOT 2024 traffic counts. At the peak count site, I-94 through Pleasant Prairie carries 105,000 vehicles per day (Annual Average Daily Traffic). Highway 50 and STH 31 / 39th Avenue each carry roughly 35,000 AADT at their busiest counts. The map below shows every active WisDOT count site in and around the Village, with the I-94 corridor clustered along the western edge.
WisDOT 2024 traffic count sites in and around Pleasant Prairie. Each dot is an active count site; dot size scales with annual average daily traffic.
Part V
The broader Wisconsin pattern
To put Pleasant Prairie's tax-base trajectory in context, we pulled equalized-value data for every Wisconsin village with a 2015 population between 2,000 and 50,000 — 108 villages in total. For each one we measured how much its total tax base grew between 2015 and 2023, and then we asked a simple question: did villages that were already more industrial in 2015 grow their total tax base faster or slower than villages that were more residential?
The answer, across this sample, is slower. Villages that were already tilted toward commercial and industrial property in 2015 grew their total tax base less over the following eight years than residential-heavy peers, on average. The gap is large enough to be statistically meaningful at conventional thresholds.
An important caveat. The 2015–2023 window coincided with a national housing boom. Residential property values rose sharply across Wisconsin. A village whose tax base is mostly residential got lifted a lot by that boom. A village whose tax base is half industrial — because industrial property doesn't appreciate the same way — got lifted less. In other words, this result might not be about industrial development at all; it might simply reflect how much residential value each village had available to ride the housing cycle up on. To actually isolate the effect of industrial development decisions on long-run tax base, you would need a different kind of study — one that follows specific villages through time around individual large industrial projects. We don't have that here, and we're not making that claim.
What this result does say is that the common shorthand — "more industrial tax base means faster total tax-base growth" — was not true for Wisconsin villages during this particular eight-year window. That is a descriptive pattern worth putting on the table. It is not a cause-and-effect conclusion.
Technical details. Cross-sectional OLS across 108 WI villages (2015 ACS population 2,000–50,000). Dependent variable: percent change in total equalized value, 2015–2023. Key independent variable: 2015 commercial + manufacturing share of equalized value. Controls: log of 2015 total equalized value; great-circle distance from the village centroid to Milwaukee and to Chicago. Standard errors are HC1-robust; continuous variables are winsorized at the 1st and 99th percentiles. Coefficient on the key independent variable: −66.6 percentage points, standard error 31.0, p = 0.034, n = 108. For three other dependent variables tested (population change, residential equalized-value growth, and change in commercial + manufacturing share), the coefficient on baseline industrial share is not statistically significant at conventional levels.
Part VI
What the data show: six factual takeaways
This section summarizes the six observations we think the 2035 Comprehensive Plan process may find useful to have on the table as a shared factual baseline. We do not prescribe policy — the Village Board and planning commissioners are closer to the specific tradeoffs than any outside researcher.
The commercial + manufacturing share of Pleasant Prairie's equalized value is 52.9 percent in 2025.
The share was 35.5 percent in 2010. The two series (commercial + mfg and residential) first crossed in 2021. The level has moved gradually rather than abruptly and dipped briefly in 2023 before resuming the upward trend in 2024 and 2025. See Part I.
Four of six peer Wisconsin villages we examined have crossed or are approaching the 50 percent line.
Pleasant Prairie and Sturtevant are above it. Mount Pleasant is at 49.9 percent and moving quickly. Bristol has climbed into the mid-40s. Germantown and Menomonee Falls have been essentially flat near one-third. The regional corridor contains both trajectories, not one. See Part I.
At the 2022 snapshot, Pleasant Prairie had 18,075 jobs and 11,380 employed residents.
The ratio is 1.59 jobs per employed resident. 1,514 workers (8.4 percent of jobs) both live and work in the Village. 21.8 percent of the Village's workforce lives in Illinois. The largest home counties are Kenosha County, WI; Lake County, IL; Racine County, WI; and Milwaukee County, WI. See Part III.
Between 2014 and 2024, Pleasant Prairie home values rose 94 percent while Kenosha County warehouse wages rose 29 percent.
At 2024 levels, the price-to-income multiple for Kenosha County warehouse workers relative to the median Pleasant Prairie home is 8.1. At 2014 levels it was 5.4. The manufacturing-industry price-to-income multiple rose from 3.9 to 5.4 over the same period. QCEW averages include supervisors and salaried staff, so frontline-worker ratios are plausibly higher. See Part II.
I-94 through Pleasant Prairie carries 105,000 vehicles per day at its peak count.
Highway 50 and STH 31 each carry roughly 35,000 AADT at their busiest counts. These are WisDOT 2024 values. See Part IV.
Across 108 comparable Wisconsin villages, higher baseline commercial + manufacturing share in 2015 is associated with slower 2015–2023 total tax-base growth.
The association is not a causal estimate. It is a cross-sectional OLS result (−66.6 percentage points, HC1 SE 31.0, p = 0.034, n = 108) that may partly reflect the mechanics of the 2015–2023 residential housing boom rather than any general property of industrial development. We report it as descriptive color only. See Part V.
These six observations are the factual record the charts support. What weight to give them relative to other considerations — property tax base stability, economic diversity, employer retention, regional coordination, and the many local factors we are not positioned to assess — is a question for the Village. Our contribution is the data and the documentation.
Data, methods, and reproducibility
Every figure on this page is computed from public data and reproducible from the code that produced it. The sources and methods are documented below.
Tax base composition, 1984–2025
Wisconsin Department of Revenue Equalized Property Values dataset, extracted from the WI DOR Tableau Public workbook. 871,929 rows covering every Wisconsin municipality. Cross-validated against the Pleasant Prairie 2018 Statement of Assessment, which matches the equalized total within 1 percent. Shares are computed from equalized value throughout.
Commute patterns, 2022
US Census LEHD LODES8 Origin-Destination (main + auxiliary) and Workplace Area Characteristics files, pulled via the lehdr R package. Worker flows are filtered to the 432 census blocks whose centroids fall inside the Pleasant Prairie Village boundary (2020 TIGER/Line). LODES applies confidentiality noise infusion at the block level; village-scale aggregations are more stable than individual block counts. LODES reports jobs, not unique persons.
Home values, 2000–2026
Zillow Home Value Index, All Homes (SFR + condo), mid-tier, smoothed seasonally adjusted, ZIP 53158. Annual figures are the mean of the twelve monthly observations.
Wages, 2014–2024
BLS Quarterly Census of Employment and Wages (QCEW) Open Data API, Kenosha County (area 55059), private ownership, NAICS 493 (Warehousing and Storage), 31-33 (Manufacturing), and 48-49 (Transportation and Warehousing). QCEW avg_annual_pay is an establishment-level average that includes supervisors and salaried staff alongside frontline workers; it is an upper bound on typical frontline pay.
Land use, 2025
Wisconsin Statewide Parcel Map V11, Wisconsin State Cartographer's Office. Parcel centroids joined into the Village boundary in the Wisconsin planar CRS (EPSG:3071). Multi-class parcels attributed to their first-listed class.
Traffic, 2024
Wisconsin Department of Transportation Traffic Counts feature service. 225 active count sites in the Pleasant Prairie corridor (I-94, Highway 50, STH 31, Highway 165, county highways).
Price-to-income and PITI metrics
Price-to-income multiple = ZHVI / annual wage. Affordability bands follow the Demographia International Housing Affordability Survey (≤3 affordable, 3–5 moderately unaffordable, >5 severely unaffordable). The PITI calculation uses a 30-year fixed mortgage at 6.5 percent APR, 20 percent down, 1.8 percent effective property tax (Kenosha County average), and 0.5 percent insurance.
Tipping-point regression
Cross-sectional OLS with HC1 heteroskedasticity-robust standard errors across 108 Wisconsin villages with 2015 ACS 5-year population between 2,000 and 50,000. Continuous variables winsorized at the 1st and 99th percentiles. Dependent variables: population change 2015–2023, residential equalized value growth 2015–2023, total equalized value growth 2015–2023, and change in commercial + manufacturing share. Controls: log total equalized value in 2015, Haversine distance from the village centroid to Milwaukee and Chicago. The specification is descriptive, not causal, and is reported in Part V with an explicit caveat.
AI disclosure: Data acquisition, analysis code, regression specifications, figure production, and document drafting for this project were performed with assistance from Anthropic's Claude via Claude Code. The AI system was used as a research copilot under direct supervision by the principal investigator, including an internal two-reviewer methodological audit that identified and corrected framing and interpretation issues in the tipping-point regression, added Mount Pleasant as a sixth comparator village, and rebalanced several affordability caveats. All numerical claims have been independently verified against raw WI Department of Revenue equalized values, US Census LEHD LODES8, BLS QCEW, Zillow Research, WI Statewide Parcel Map V11, and WisDOT Traffic Counts sources. A complete audit log and reproducible analysis scripts are available on request.